Fig. C.5.
Download original image
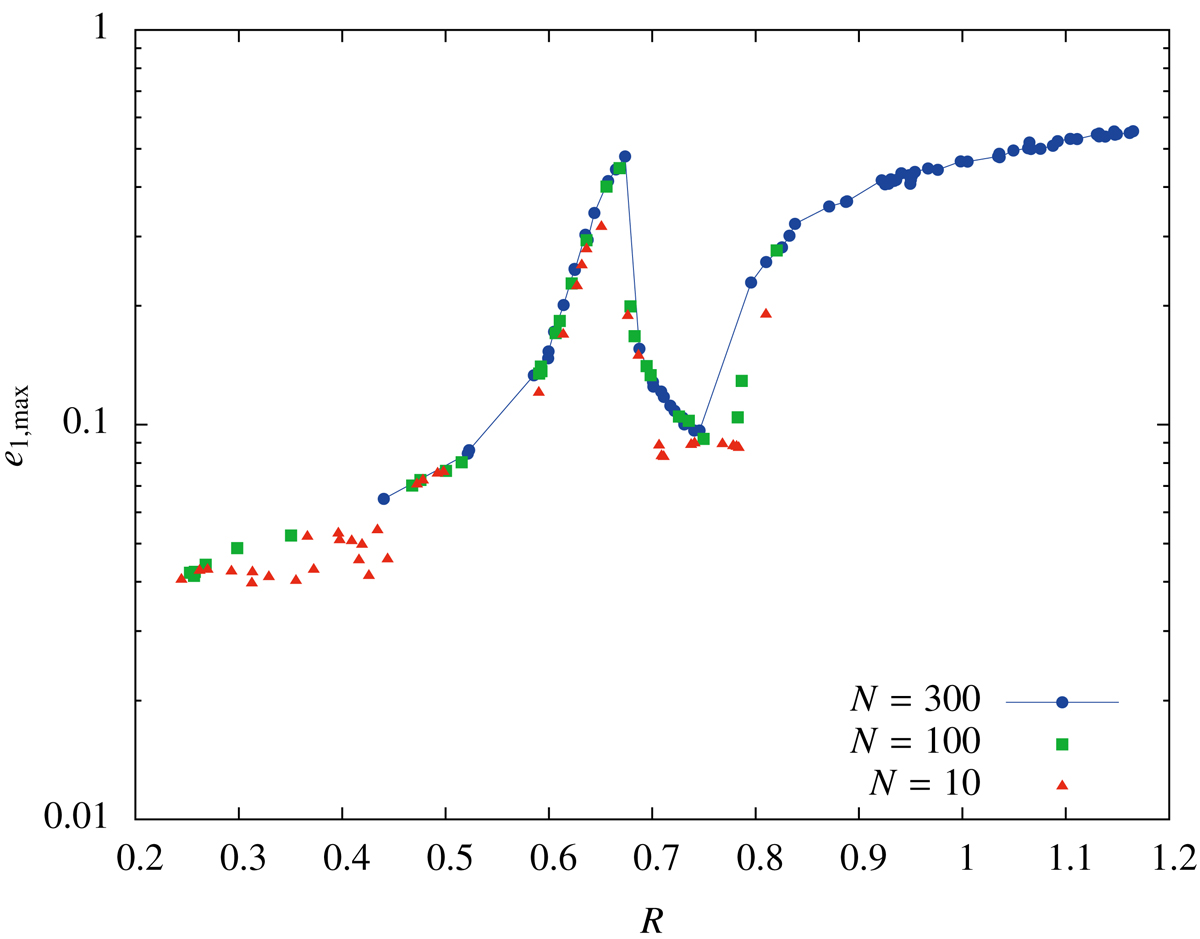
Maximum eccentricity reached after ![]() , where N ∈ {10, 100, 300} are denoted by the colors. The initial conditions are m1 = 1M⊙, m2 = 0.001M⊙, m3 = 106M⊙, a1 = 105 ℛ1, itot = 65°, e1 = 0.001, e2 = 0.7, and a2 was varied to simulate different ℛ. An eccentricity excitation around ℛ = 0.65 is evident. Simulations were performed using a regularized Hermite integrator with a time-step parameter of η = 0.003 for N = 10 and N = 100 and η = 0.002 for N = 300. Each data point is an independent simulation that took a wall-clock time of ∼20 min for N = 10, ∼3 hours for N = 100, and ∼12 hours for N = 300.
, where N ∈ {10, 100, 300} are denoted by the colors. The initial conditions are m1 = 1M⊙, m2 = 0.001M⊙, m3 = 106M⊙, a1 = 105 ℛ1, itot = 65°, e1 = 0.001, e2 = 0.7, and a2 was varied to simulate different ℛ. An eccentricity excitation around ℛ = 0.65 is evident. Simulations were performed using a regularized Hermite integrator with a time-step parameter of η = 0.003 for N = 10 and N = 100 and η = 0.002 for N = 300. Each data point is an independent simulation that took a wall-clock time of ∼20 min for N = 10, ∼3 hours for N = 100, and ∼12 hours for N = 300.
Current usage metrics show cumulative count of Article Views (full-text article views including HTML views, PDF and ePub downloads, according to the available data) and Abstracts Views on Vision4Press platform.
Data correspond to usage on the plateform after 2015. The current usage metrics is available 48-96 hours after online publication and is updated daily on week days.
Initial download of the metrics may take a while.