Fig. 5.
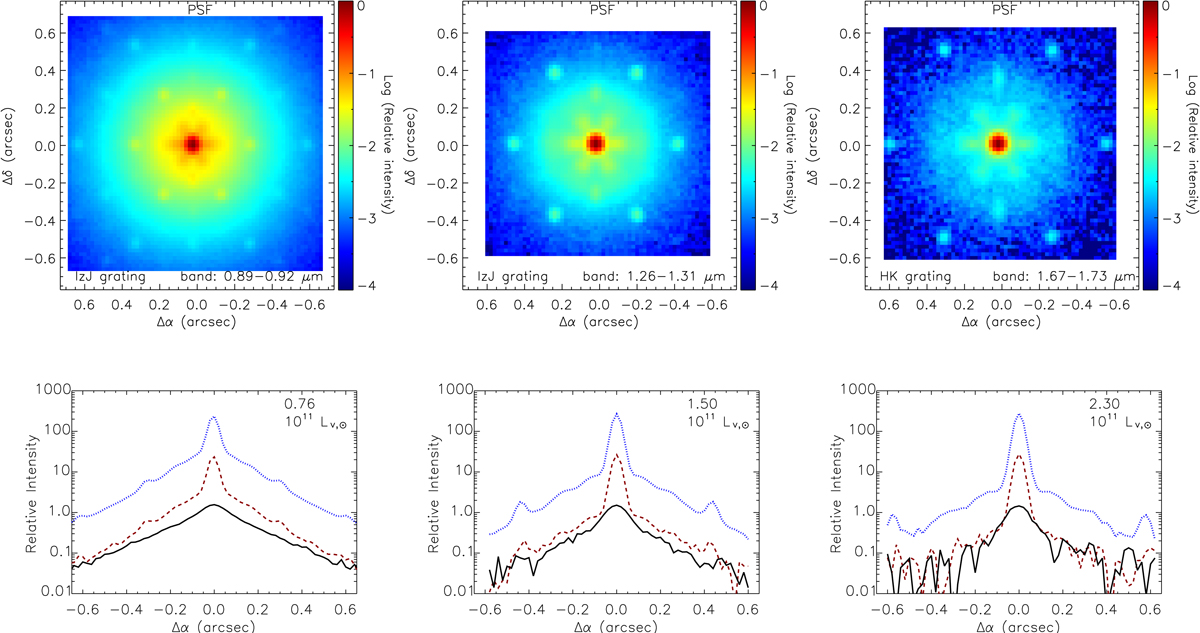
Download original image
PSF for HARMONI in the instrument configuration summaries in Table 3 at three wavelengths ranges. Upper panels: filter-band images (0.89−0.92 μm (left), 1.26−1.31 μm (centre), and 1.67−1.73 μm (right)). The 20 × 20 mas2 scale of our mock HARMONI observations undersamples the potential FWHM of the PSF, which varies from ∼6 mas at the bluest filter to ∼11 mas at the reddest one. Intensities are in logarithmic scale and normalised to the peak in each case. Lower panels: radial profiles along the right ascension axis and through the centre obtained from the filter-band image of the lenticular host galaxy scaled to 1011 Lv, ⊙ without QSO (black profile), the QSO of L[OIII] = 1042 (red dashed-profile), and the QSO of L[OIII] = 1043 (blue dotted-line). Intensities are normalised to the peak of the host in each case.
Current usage metrics show cumulative count of Article Views (full-text article views including HTML views, PDF and ePub downloads, according to the available data) and Abstracts Views on Vision4Press platform.
Data correspond to usage on the plateform after 2015. The current usage metrics is available 48-96 hours after online publication and is updated daily on week days.
Initial download of the metrics may take a while.