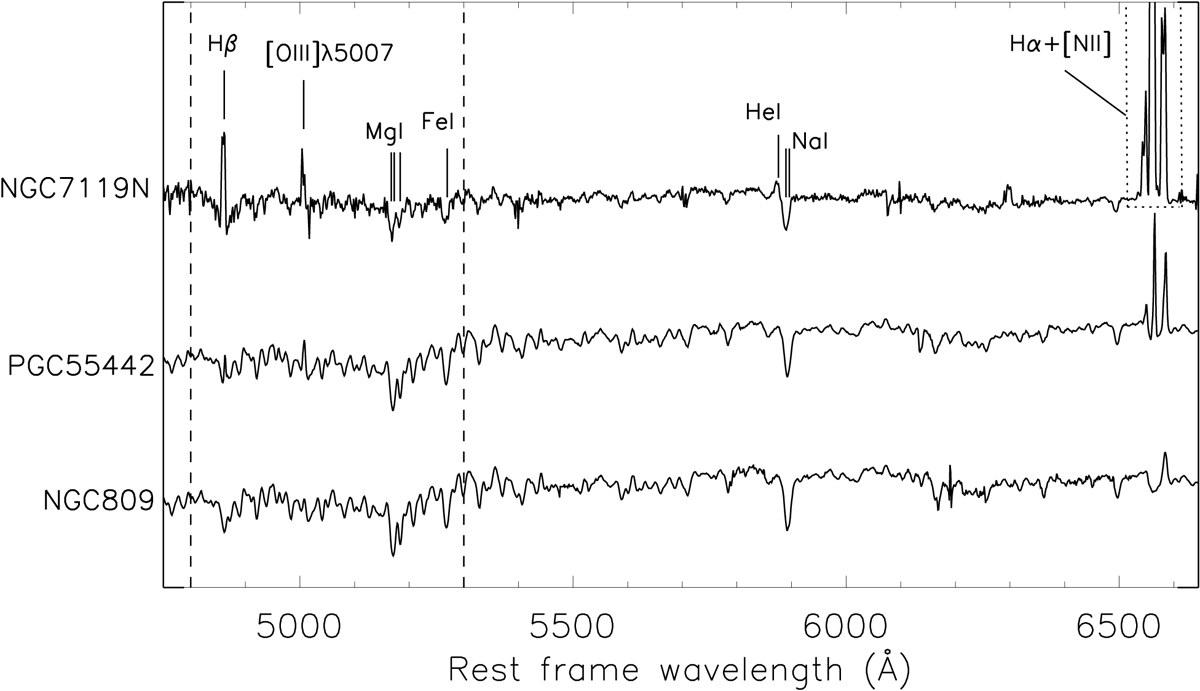
Fig. A.1.
Download original image
Total spectra of the three nearby galaxies picked as host for our simulations of AGN+host observations with HARMONI. Spectra were normalised to the average intensity in the plotted wavelength range. The horizontal axis corresponds to rest-frame wavelengths. The spectra are shown in logarithmic scale and arbitrarily shifted on the vertical axis. Dashed-vertical lines indicate the spectral range included in the HARMONI simulations. Labels mark the position of several emission (i.e. Hβ, [O III]λ5007, HeIλ5876, [NII]λ6543, Hα, and [NII]λ6584) and absorption lines (i.e. MgIλ5163, 5172, 5183, FeIλ5269, and NaIλ5889, 5895). Dotted rectangle indicates the zoomed-in image of a region in Fig. A.5 for the NGC 7119A spectrum.
Current usage metrics show cumulative count of Article Views (full-text article views including HTML views, PDF and ePub downloads, according to the available data) and Abstracts Views on Vision4Press platform.
Data correspond to usage on the plateform after 2015. The current usage metrics is available 48-96 hours after online publication and is updated daily on week days.
Initial download of the metrics may take a while.