Fig. 13.
Download original image
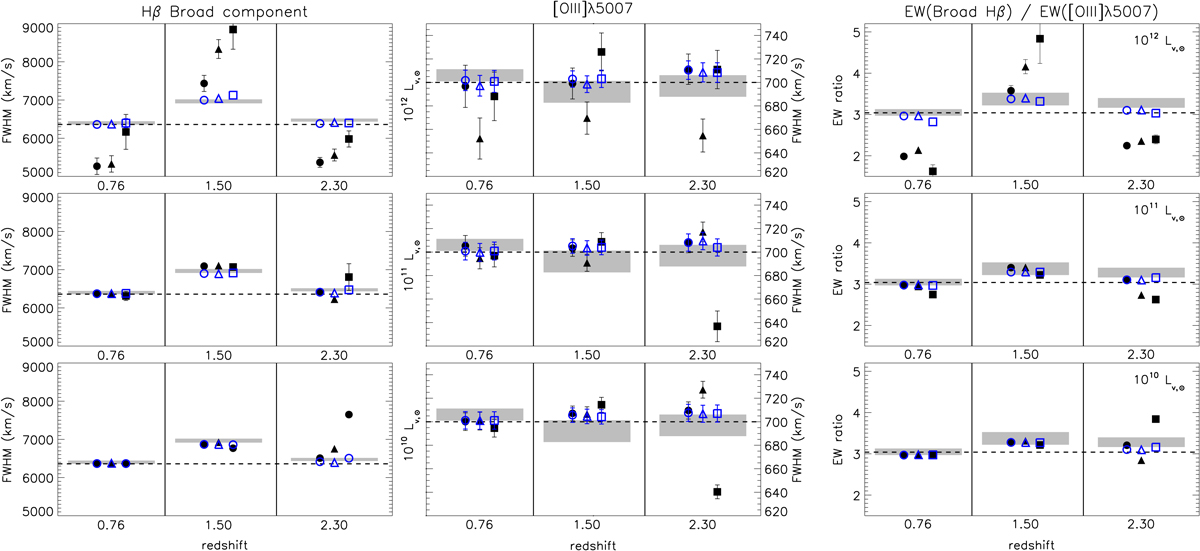
Full width at half maximum of the broad Hβ (left panels) and narrow [OIII]λ5007 (central panels) components of the Gaussian profiles modelling the emission lines in the AGN+hosts’ integrated-spectra at the different redshifts (see text). Right panel: equivalent-width ratio of the broad and narrow components. Different symbols indicate the distinct hosts (circles → NGC 809, triangles → PGC 055442, and squares → NGC 7119A), and their colours indicate the [OIII] luminosities of the AGN (black filled symbols → 1042, and blue open symbols → 1043 erg s−1). Error bars correspond to the uncertainties provided by the QSFIT13 package if larger than the symbol size. Dashed lines are the adopted values to simulate the emission of the central AGN (see Sect. 3.2). Grey bands indicate the parameters obtained when fitting the integrated spectra obtained from the mock HARMONI data for the pure AGN, enclosing the values and uncertainties for the two AGN luminosities.
Current usage metrics show cumulative count of Article Views (full-text article views including HTML views, PDF and ePub downloads, according to the available data) and Abstracts Views on Vision4Press platform.
Data correspond to usage on the plateform after 2015. The current usage metrics is available 48-96 hours after online publication and is updated daily on week days.
Initial download of the metrics may take a while.