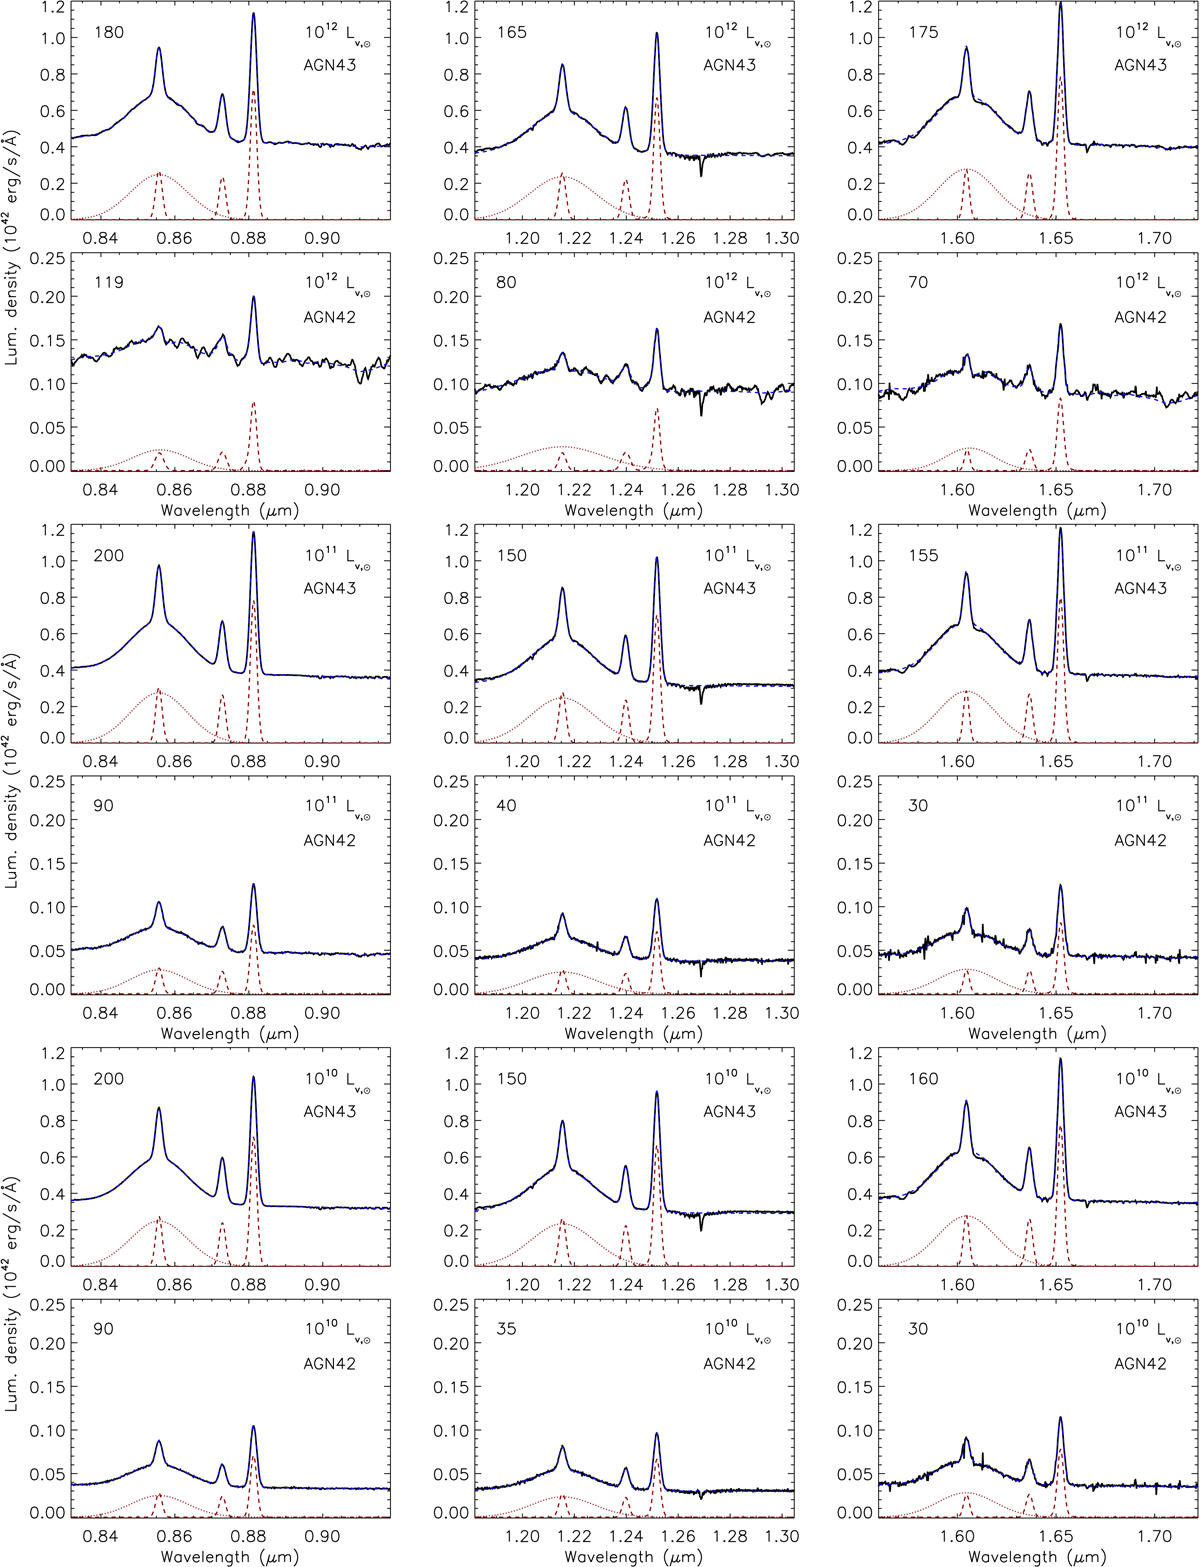
Fig. 12.
Download original image
Integrated spectra for the AGN+host (lenticular galaxy) at redshifts 0.76 (left), 1.50 (centre), and 2.30 (right) obtained by adding the signal from the spaxels within the host’s effective radius (see Sect. 4.2). The labels in the top right corner indicate the host and AGN (AGN42 → 1042 and AGN43 → 1043 erg s−1) luminosities. The numbers in the top left corners indicate the S/N in the rest-frame 5050−5250 Å obtained using the der_snr algorithm. The blue-dotted lines correspond to the QSFIT model to each spectrum. Red lines draw the Gaussian profiles fitting the broad (dotted line) and narrow (dashed line) components of the emission lines in the AGN spectra.
Current usage metrics show cumulative count of Article Views (full-text article views including HTML views, PDF and ePub downloads, according to the available data) and Abstracts Views on Vision4Press platform.
Data correspond to usage on the plateform after 2015. The current usage metrics is available 48-96 hours after online publication and is updated daily on week days.
Initial download of the metrics may take a while.