Fig. 1.

Download original image
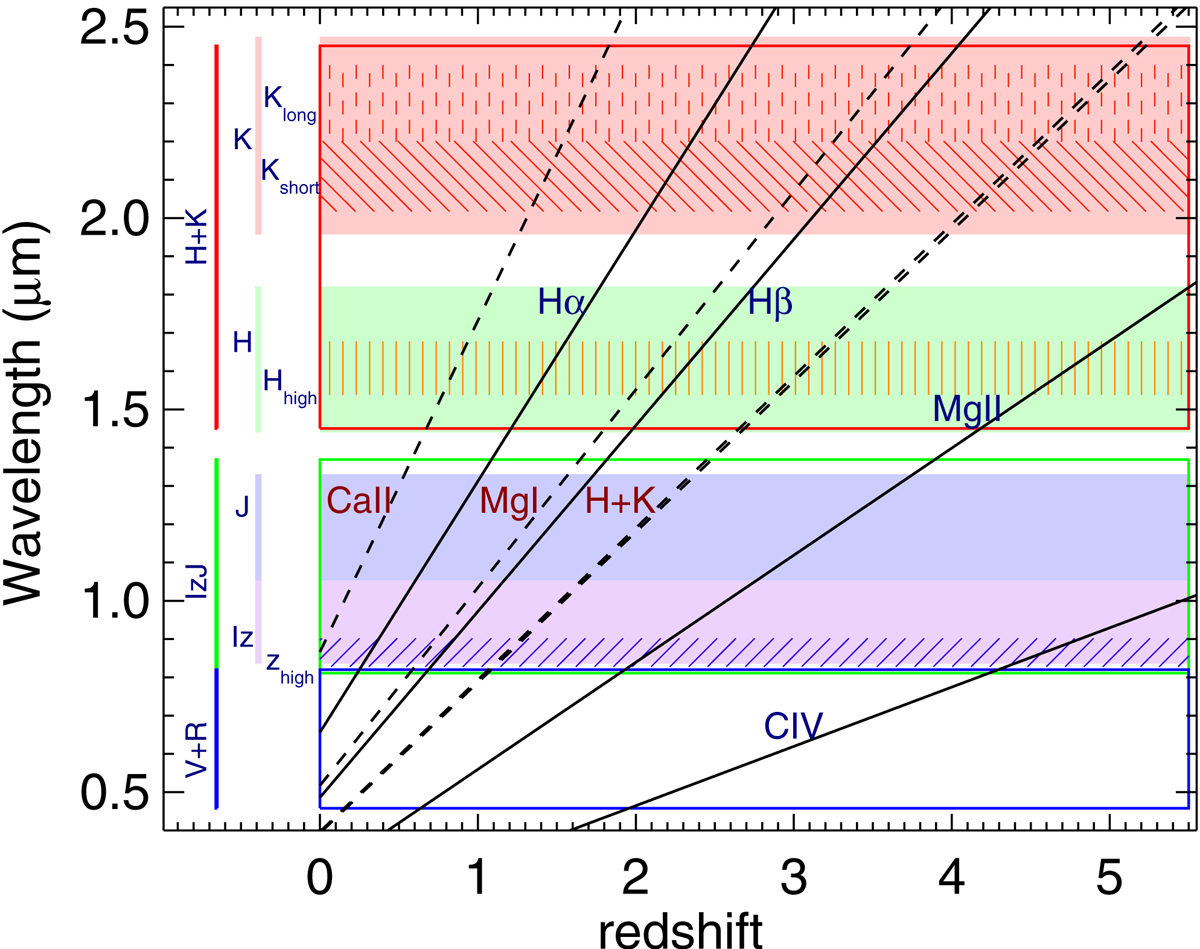
Key spectral features to measure MBH and σ⋆ observable at each HARMONI band as a function of the redshift. Black solid and dashed lines correspond to emission (i.e. CIV, MgII, Hβ, and Hα) and absorption (i.e. CaIIH+K, MgI, and CaII) features, respectively. The low-resolution bands correspond to the wavelength range between blue (V + R), green (I + z + J), and red (H + K) rectangles. Purple (I + z), blue (J), green (H), and red (K) filled rectangles mark the wavelength range of medium-resolution gratings. Hatch patterns mark the high-resolution bands: purple, striped, inclined: Zhigh; orange striped: Hhigh; red, striped; inclined: Kshort; and red, dashed, striped: Klong.
Current usage metrics show cumulative count of Article Views (full-text article views including HTML views, PDF and ePub downloads, according to the available data) and Abstracts Views on Vision4Press platform.
Data correspond to usage on the plateform after 2015. The current usage metrics is available 48-96 hours after online publication and is updated daily on week days.
Initial download of the metrics may take a while.


