| Issue |
A&A
Volume 659, March 2022
|
|
|---|---|---|
| Article Number | A154 | |
| Number of page(s) | 9 | |
| Section | Extragalactic astronomy | |
| DOI | https://doi.org/10.1051/0004-6361/202141196 | |
| Published online | 21 March 2022 | |
NOEMA confirmation of an optically dark ALMA–AzTEC submillimetre galaxy at z = 5.24
A late-stage starburst prior to quenching
1
Kapteyn Astronomical Institute, University of Groningen, PO Box 800, 9700 AV Groningen, The Netherlands
2
Department of Microelectronics, Delft University of Technology, PO Box 5031, 2600 GA Delft, The Netherlands
3
Centre for Extragalactic Astronomy, Department of Physics, Durham University, South Road, Durham DH1 3LE, UK
e-mail: soh.ikarashi@durham.ac.uk
4
European Southern Observatory, Karl-Schwarzschild-Strasse 2, 85748 Garching, Germany
5
Institute of Astronomy, Graduate School of Science, The University of Tokyo, 2-21-1 Osawa, Mitaka, Tokyo 181-0015, Japan
6
Research Center for the Eary Universe, School of Science, The University of Tokyo, 7-3-1 Hongo, Bunkyo, Tokyo 113-0033, Japan
Received:
27
April
2021
Accepted:
2
October
2021
We have obtained deep 1 and 3 mm spectral-line scans towards a candidate z ≳ 5 ALMA-identified AzTEC submillimetre galaxy (SMG) in the Subaru/XMM-Newton Deep Field (or UKIDSS UDS), ASXDF1100.053.1, using the NOrthern Extended Millimeter Array (NOEMA), aiming to obtain its spectroscopic redshift. ASXDF1100.053.1 is an unlensed optically dark millimetre-bright SMG with S1100 μm = 3.5 mJy and KAB > 25.7 (2σ), which was expected to lie at z = 5–7 based on its radio–submillimetre photometric redshift. Our NOEMA spectral scan detected line emission due to 12CO(J = 5–4) and (J = 6–5), providing a robust spectroscopic redshift, zCO = 5.2383 ± 0.0005. Energy-coupled spectral energy distribution modelling from optical to radio wavelengths indicates an infrared luminosity LIR = 8.3−1.4+1.5 × 10¹² L⊙, a star formation rate SFR = 630−380+260 M⊙ yr−1, a dust mass Md = 4.4−0.3+0.4 × 10⁸ M⊙, a stellar mass Mstellar = 3.5−1.4+3.6 × 10¹¹ M⊙, and a dust temperature Td = 37.4−1.8+2.3 K. The CO luminosity allows us to estimate a gas mass Mgas = 3.1 ± 0.3 × 10¹⁰ M⊙, suggesting a gas-to-dust mass ratio of around 70, fairly typical for z ∼ 2 SMGs. ASXDF1100.053.1 has ALMA continuum size Re = 1.0−0.1+0.2 kpc, so its surface infrared luminosity density ΣIR is 1.2−0.2+0.1 × 10¹² L⊙ kpc−2. These physical properties indicate that ASXDF1100.053.1 is a massive dusty star-forming galaxy with an unusually compact starburst. It lies close to the star-forming main sequence at z ∼ 5, with low Mgas/Mstellar = 0.09, SFR/SFRMS(RSB) = 0.6, and a gas-depletion time τdep of ≈50 Myr, modulo assumptions about the stellar initial mass function in such objects. ASXDF1100.053.1 has extreme values of Mgas/Mstellar, RSB, and τdep compared to SMGs at z ∼ 2–4, and those of ASXDF1100.053.1 are the smallest among SMGs at z > 5. ASXDF1100.053.1 is likely a late-stage dusty starburst prior to passivisation. The number of z = 5.1–5.3 unlensed SMGs now suggests a number density dN/dz = 30.4 ± 19.0 deg−2, barely consistent with the latest cosmological simulations.
Key words: infrared: galaxies / galaxies: formation / galaxies: high-redshift / submillimeter: galaxies
© ESO 2022
1. Introduction
When and how most massive galaxies formed in the Universe is one of the intriguing open questions in astronomy. Since the discovery of submillimetre galaxies (SMGs; e.g., Smail et al. 1997; Hughes et al. 1998; Eales et al. 1999) as high-redshift dust-obscured massive star-forming galaxies with typical infrared (IR) luminosities LIR ≥ 1012 L⊙, SMGs have been thought to be progenitors of today’s massive passive galaxies (e.g., Sanders et al. 1988; Hopkins et al. 2008). Atacama Large Millimeter/Submillimeter Array (ALMA) has shown that their far-IR dust continuum sizes are consistent with this evolutionary link, maybe via a compact quiescent galaxy phase (e.g., Toft et al. 2014; Ikarashi et al. 2015; Simpson et al. 2015).
Continuum observations at λobs ∼ 1 mm have a near-uniform sensitivity to far-IR luminosity over the redshift range z ∼ 1–6, owing to a strong negative K correction (Blain & Longair 1993). They are thus an ideal tool with which to study the redshift evolution of dusty massive star-forming galaxies. Optical–near-IR spectroscopic (Chapman et al. 2005; Danielson et al. 2017) and photometric redshift studies (e.g., Miettinen et al. 2017a; Cowie et al. 2018; Stach et al. 2019; Dudzevičiūtė et al. 2020) of SMGs indicate that a majority of SMGs lie at z ∼ 2–3 where the cosmic star formation rate (SFR) is thought to peak (e.g., Madau & Dickinson 2014; Béthermin et al. 2017; Pillepich et al. 2018; Gruppioni et al. 2020). However, there have been suggestions that a significant fraction of SMGs could be located at z ≳ 3, especially amongst the brightest ones, which would explain why they so often lack optical, near-IR, or radio counterparts (e.g., Chapman et al. 2005; Ivison et al. 2007).
To pinpoint the positions of SMGs with an accuracy better than 1″, which are originally discovered by single dishes with angular resolution of ∼10″–30″ (full width at half maximum, FWHM), interferometric imaging is necessary. At the highest redshifts we must move to the millimetre (mm) or submillimetre (submm), because the K correction is not favourable at radio wavelengths. Early submm continuum imaging of bright SMGs using the Submillimeter Array (SMA) and the Plateau de Bure Interferometer (PdBI) discovered a handful of radio-faint SMGs, possibly at very high redshift (e.g., Younger et al. 2007, 2009; Cowie et al. 2009; Smolčić et al. 2012). We had to wait for ALMA, however, to conduct a systematic survey of candidate z ≳ 4–5 SMGs. ALMA continuum surveys towards many hundreds of SMGs (e.g., Hodge et al. 2013; Ikarashi et al. 2015, 2017a; Miettinen et al. 2017a; Stach et al. 2019; Simpson et al. 2020) have pinpointed their positions and have revealed a significant number of optically dark SMGs that are extremely faint at optical–near-IR wavelengths (e.g., Simpson et al. 2014; Chen et al. 2015; Ikarashi et al. 2015, 2017b; Cowie et al. 2018; Williams et al. 2019; Smail et al. 2021) despite high IR luminosities (LIR = 1012−13 L⊙) suggesting that they are located at z ≳ 4. Some z ≳ 4 candidate H-band drop, IRAC-selected galaxies have overlapped with SMGs (Wang et al. 2019). However, the redshifts of these dark SMGs usually remain vague. Unless they are magnified by gravitational lensing, which then biases the resulting redshift distribution, it is difficult and expensive to obtain spectroscopic redshifts for dark SMGs. To do so requires an appropriately deep spectral-line scan. Millimetre line scans towards gravitationally lensed SMGs (or dusty star-forming galaxies, DSFGs) have been extremely successful, revealing the redshift distribution of target lensed SMGs, including some DSFGs at z ≳ 5 (Vieira et al. 2013; Weiß et al. 2013; Reuter et al. 2020). Although biased, these results suggested strongly that the underlying submm-bright galaxy population might have a longer high-redshift tail than had previously been suggested. However, unambiguous confirmations (by more than two lines) of unlensed SMGs at z > 5 are rare: AzTEC-3 (Capak et al. 2011; Riechers et al. 2020), HDF850.1 (Walter et al. 2012), MAMBO-9 (Casey et al. 2019), and GN10 (Riechers et al. 2020).
In the wider cosmological context, the redshifts of the optically dark SMGs are important to our understanding of the formation of massive galaxies. Recent near- and mid-IR surveys have reported the discovery of massive, passive, and compact quiescent galaxies (cQGs) at high redshift z ≳ 3–4 (Straatman et al. 2015; Schreiber et al. 2018; Merlin et al. 2019; Santini et al. 2019). SMGs at even higher redshifts are expected to be the progenitors of these massive passive galaxies, but where are they?
To be credible, cosmological simulations must be able to generate SMGs. Available simulations predict different redshift distributions for SMGs, and observational updates on redshift distribution of SMGs act to stimulate improved simulations (Baugh et al. 2005; Hayward et al. 2013; Cowley et al. 2015; Lacey et al. 2016; McAlpine et al. 2019). Interestingly, the latest observational studies of SMGs suggest that there may be more SMGs than previously thought (Stach et al. 2019; Riechers et al. 2020; Simpson et al. 2020). Revealing the complete redshift distribution of SMGs is thus essential if we are to understand the formation of massive galaxies.
In this paper we report a pilot millimetre spectral-line scan using the NOthern Extended Millimeter Array (NOEMA) interferometer towards a plausible z ≳ 5 candidate SMG, ASXDF1100.053.1, discovered using AzTEC and pinpointed using ALMA (Ikarashi et al. 2015, 2017b). Deep multi-wavelength images suggest this SMG is unlikely to be lensed (Ikarashi et al. 2017b; Smail et al. 2021). We discuss the nature of this SMG and the potential impact of further z > 5 SMG surveys including our ongoing NOEMA redshift survey towards z > 5 candidate ALMA-identified AzTEC SMGs, based on this pilot study that explores the diversity of z ≳ 5 SMGs and their volume density. Despite growing evidence that the stellar initial mass function (IMF) may be quite different in starburst environments (e.g., Zhang et al. 2018), we adopt Chabrier’s IMF (Chabrier 2003) throughout this paper so that we can compare the nature of ASXDF1100.053.1 with other systems from the literature. For consistency and fair comparison, throughout this paper physical quantities of ASXDF1100.053.1 and galaxies from the literature are based on an energy-coupled spectral energy distribution (SED) model using MAGPHYS code (da Cunha et al. 2008, 2013, 2015). Regarding ASXDF1100.053.1, for a consistency check between methods, some physical quantities based on classical methods are compared with those by MAGPHYS. We use a cosmology with H0 = 70 km s−1 Mpc−1, ΩM = 0.3, and ΩΛ = 0.7.
2. NOEMA scans in 1 and 3 mm spectral windows
2.1. Observations
In order to determine the spectroscopic redshift of ASXDF1100.053.1, we conducted NOEMA wide-band spectral scans. Based on the radio–submm photometric redshift of the target SMG,  (Ikarashi et al. 2017b), we tailored the observing plan to secure a robust unambiguous redshift at z ≳ 5. We obtained 31 GHz of coverage in the 3 mm atmospheric window, targeting CO and/or [C I] lines at z = 4–6, as well as 31 GHz in the 1 mm window targeting the [C II] line at z ≥ 6.
The 3 mm scan covered 80.4–111.4 GHz, contiguously, via two spectral set-ups, which made our data sensitive to at least two lines out of CO(4–3), CO(5–4), CO(6–5), and [C I](1–0) at z ∼ 3–6. The 1 mm scan covered 240.4–271.4 GHz, or z = 6.0–6.9 in [C II], where the effectiveness of the 3 mm scan was expected to deteriorate1 at the highest redshifts. Given the known CO excitation of SMGs (e.g., Ivison et al. 2011; Riechers et al. 2011; Bothwell et al. 2013; Spilker et al. 2014), CO lines observable at 3 mm at z ≳ 6 are expected to be very faint. The effect of the cosmic microwave background (CMB) on CO line flux at z ≳ 6 (e.g., da Cunha et al. 2013; Zhang et al. 2016) was also a concern. The combination of the extreme brightness of [C II] emission from high-redshift ultraluminous IR galaxies (ULIRGs) (e.g., Stacey et al. 2010; Swinbank et al. 2012; Cooke et al. 2018) and the high sky transparency at 1 mm allows more efficient identification of redshifts at z ≳ 6 than CO line scans.
Observations were conducted in 2017, 2018, and 2019 (project codes: W17ES, W18EX, and W19EA; P.I.: Ikarashi). The 3 mm scans were executed using the C configuration, with ten antennas in operation, covering baseline lengths between 24 and 370 m. The 1 mm scans were executed using the C configuration with ten antennas in operation, or the D configuration with nine antennas in operation, which covered baseline lengths between 24 and 370 m, and 24 and 180 m, respectively. 3C 454.3 or 3C 84 were used as bandpass calibrators, LKHA 101 or MWC 349 as primary flux density calibrators, and 0238−084 as the local complex gain calibrator. For one of the 3 mm tracks, 0238−084 was also used for bandpass calibration. The observing log is summarised in Table 1.
NOEMA 3 and 1 mm spectroscopic observations.
2.2. Results
We reduced the data using GILDAS2. First we ran the NOEMA pipeline for all of the data. After the pipeline, if necessary, we flagged additional data, corrected the phase delays, and re-calibrated the phase and/or amplitude. The synthesised beam size for the 3 mm scans was ∼4 arcsec (FWHM); that for the 1 mm scans was ∼2–2.5 arcsec (FWHM). The 3 mm and 1 mm datacubes achieved an rms noise of 210–300 and 870–1000 μJy beam−1, respectively, for a velocity resolution of ∼100 km s−1 (Table 1).
We searched for line emission in the NOEMA 3 and 1 mm spectral cubes at the position determined by ALMA for ASXDF1100.053.1 (Ikarashi et al. 2015, 2017b). In the 1 mm spectral cubes no significant (S/N ≥ 5) lines were found, indicating that ASXDF1100.053.1 is not located within the [C II] redshift coverage of the 1 mm scan, z = 6.0–6.9. In the 3 mm spectral cubes two significant line candidates were discovered, one at νobs = 92.37 GHz and the other at νobs = 110.83 GHz (Fig. 1). Of the potentially detectable line candidates from SMGs, the two lines correspond to CO(5–4) and CO(6–5), suggesting that ASXDF1100.053.1 lies at z = 5.2383 ± 0.0005. In order to evaluate the significance of the CO(5–4) and CO(6–5) lines, we generated continuum-subtracted CO(5–4) and CO(6–5) images by averaging channels over a width of 660 km s−1, which corresponds to 2 × 2σ of ΔvFWHM,CO(5−4) = 380 ± 58 km s−1. The resulting CO(5–4) and CO(6–5) maps are shown in Fig. 2. The respective rms noise levels for the CO(5–4) and CO(6–5) maps are 79 and 130 μJy beam−1, corresponding to 0.052 and 0.095 Jy km s−1 beam−1, respectively. The CO(5–4) and CO(6–5) lines are detected with S/N values of 10 and 5.9, with ICO = 0.530 ± 0.052 and 0.550 ± 0.095 Jy km s−1 beam−1, respectively. The emission in neither line is spatially resolved.
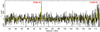 |
Fig. 1. Composite spectrum of ASXDF1100.053.1, covering from 80.4 to 111.3 GHz after combining all our NOEMA scans at 3 mm. Continuum emission has been subtracted. The spectral resolution is 30 MHz, which corresponds to 97 km s−1 and 81 km s−1 at 92.4 GHz for CO(5–4) and at 110.8 GHz for CO(6–5), respectively. |
By averaging the spectral channels, excluding those used to make maps of the CO lines, we have generated NOEMA 1 and 3 mm continuum maps (Fig. 2). The continuum maps achieve rms sensitivities of 63 and 8.9 μJy beam−1, respectively. ASXDF1100.053.1 is detected with S1172 μm = 3000 ± 63 μJy (48σ) and S3000 μm = 110 ± 8.9 μJy (12σ). The NOEMA 1 mm continuum flux density is fully consistent with our previous measurement from ALMA, S1132 μm = 3450 ± 100 μJy (Ikarashi et al. 2015), given that an expected flux density correction factor between the NOEMA and ALMA observing frequencies, 255 and 265 GHz, is around 0.86 for a dust emissivity index of β = 1.8. The observed properties are summarised in Table 2.
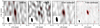 |
Fig. 2. CO(5–4), CO(6–5), 3 mm continuum, and 1 mm continuum images of ASXDF1100.053.1. Contour levels are plotted at ±2.5, 5.0, 7.5, and 10σ. The respective rms levels are 79, 130, 8.9, and 63 μJy beam−1. Respective synthesised beams of the CO(5–4), CO(6–5), 3 mm continuum, and 1 mm continuum images are 4″.3 × 1″.5 at a position angle (PA) of 6.0°, 3″.5 × 1″.2 (PA 5.8°), 4″.2 × 1″.6 (PA 7.7°), and 2″.1 × 0″.7 (PA 10.3°). |
Observed and physical properties of ASXDF1100.053.1 obtained in this paper.
3. Physical properties of ASXDF1100.053.1
3.1. Spectral energy distribution
Here we derive physical properties of ASXDF1100.053.1 from multi-wavelength data covering optical to radio wavelengths, based on its unambiguous spectroscopic redshift. We modelled the spectral energy distribution (SED) of ASXDF1100.053.1 using MAGPHYS (da Cunha et al. 2008, 2015). We used Subaru SupremeCam data (B, V, Rc, i′, and z′), UKIRT WFCAM data (J, H, and K), Spitzer IRAC and MIPS data (3.6, 4.5, 5.8, 8.0, and 24 μm), Herschel SPIRE data (250, 350, and 500 μm), SCUBA-2 850 μm data, ALMA 1100 μm data, NOEMA 3 mm data, and Jansky Very Large Array (JVLA) 6 GHz data. All these photometric data, except for the NOEMA 3 mm photometry, are described in Ikarashi et al. (2017b). We adopt the recipe for MAGPHYS modelling the SEDs of SMGs prescribed in Dudzevičiūtė et al. (2020), and handle the photometric data as follows. We treat a source as a detection if it has at least a 3σ detection. For non-detections we adopt a flux of zero and an uncertainty corresponding to 3σ in the UV to mid-IR bands at λobs ≤ 8 μm. For undetected sources in the IR bands at λobs ≥ 24 μm, we adopt a flux density of 1.5 ± 1.0σ. Our best-fit model SED and the observed SED of ASXDF1100.053.1 are displayed in Fig. 3. Physical properties derived from the SED modelling are summarised in Table 2. We adopt the median with the error of the 68% range in the probability density distribution for each physical property.
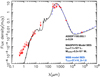 |
Fig. 3. Spectral energy distribution of ASXDF1100.053.1 in the observed frame. Red filled and open squares indicate the measured detections and upper limits, respectively, taken from this paper or from Ikarashi et al. (2017b). A solid black curve shows the best-fit SED obtained by our modelling using MAGPHYS in Sect. 3.1. A dashed blue curve shows the best-fit dust SED obtained by another modelling using modified black bodies with β = 1.8 including radio SED, which is presented in Sect. 3.1. The physical properties of the best-fit SED are not identical to the median values shown in Table 2. |
Regarding stellar mass, ASXDF1100.053.1 has significant and relevant detections at two wavelengths, λobs = 3.6 and 4.5 μm (and is tentatively detected at 5.8 μm; see Ikarashi et al. 2017b). Ikarashi et al. (2017a) estimated the stellar mass to be  M⊙ via fits to the UV, optical, and near-IR SED with the Le Phare code (Ilbert et al. 2006), assuming z = 5.5. While Mstellar from Le Phare is consistent with the Mstellar obtained from MAGPHYS with a significance of 0.9σ, the offset may come from the different assumptions for the estimation of stellar mass in these two codes (Michałowski et al. 2014); Among ALMA-identified SCUBA-2 850 μm SMGs in the COSMOS field, AS2COSMOS SMGs (Simpson et al. 2020), a median
  of 0.12
 dex for
 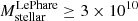 M⊙ is found (Ikarashi et al., in prep.) by comparing
  in the literature and
  by Laigle et al. (2016). In terms of absolute accuracy of stellar mass estimation of SMGs, while Michałowski et al. (2014) presented that
  was typically higher than the intrinsic stellar mass of their model SMGs by 0.1 dex, the EAGLE simulation (McAlpine et al. 2019) shows that
  is typically lower than the intrinsic stellar mass of the model SMGs by 0.3 dex (Dudzevičiūtė et al. 2020) (see also Sect. 3.4 in Hodge et al. 2019 for the uncertainty in stellar mass estimation of SMGs). The Mstellars may be underestimated because of the lack of photometric data covering the stellar emission at λrest ≳ 1 μm. The literature warns us about this potential underestimation of Mstellar, especially for massive galaxies (e.g., Maraston et al. 2006; Pforr et al. 2012).
For luminous dusty starbursts, rest-frame UV and optical wavelengths can be contaminated by emission from active galactic nuclei (AGN) (e.g., Hainline et al. 2011; Symeonidis & Page 2021), resulting in overestimates of stellar mass. Extensive SED analyses of ∼70 ALMA-identified SMGs have revealed that half of the SMGs had non-stellar contributions of less than 10% in rest-frame H, and that only around 10% of the SMGs had non-stellar contribution greater than 50% (Hainline et al. 2011). ASXDF1100.053.1 does not show any sign of a dominant AGN at UV–optical wavelengths. We can also see from its SED at longer wavelengths that ASXDF1100.053.1 is not a radio-loud AGN. Employing an AGN diagnostic using a flux ratio between 870 μm and 24 μm (Stanley et al. 2018), the lower limit, log10(F850 μm/F24 μm) > 1.9 for ASXDF1100.053.1 based on the SCUBA-2 flux and the 3σ upper limit for MIPS 24 μm flux in Ikarashi et al. (2017b), indicates that no significant AGN contribution is expected in the IR luminosity (8–1000 μm), which is a contribution of less than 20%. This also indicates that a potential contribution of AGN to the IR luminosity estimated from the rest-frame far-IR SED of ASXDF1100.053.1 should be negligible, given that in the case of a star-forming galaxy the contribution of an AGN to far-IR emission is negligible due to the contrast between the SED of an AGN and the SED of a star-forming galaxy (e.g., Netzer et al. 2007; Kirkpatrick et al. 2015). ASXDF1100.053.1 is thus likely massive, in terms of stars, with Mstellar ∼ 2–4 × 10¹¹ M⊙, though we note that for some luminous dusty galaxies nothing is as it seems (like the example presented by Ivison et al. 2019), where the UV-optical SED shows no trace of a powerful AGN lurking within the immense cocoon of dust.
We conducted the modelling of the dust SED of ASXDF1100.053.1 via a single-component modified black-body model with dust emissivity index β = 1.8 in order to estimate a classical apparent dust temperature  . ASXDF1100.053.1 has upper limits in the photometry at λobs = 250, 350, and 500 μm, where the peak of the dust SED of ASXDF1100.053.1 is expected to be located (Fig. 3). For a better constraint on TMBB, we utilised the JVLA radio photometry via the radio–far-IR luminosity correlation (Condon 1992). We modelled a radio SED by assuming a far-IR(44–122 μm)/radio luminosity ratio q = 2.34 in the local Universe (Yun et al. 2001), a SED shape of ν−0.1 for a thermal emission, and a SED shape of ν−0.8 for a non-thermal emission. The thermal emission and non-thermal emission are scaled so that the non-thermal emission dominates 90% of rest-frame 1.4-GHz luminosity. For these assumptions, we refer to Dale & Helou (2002). As a result, we obtain
 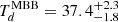 K and LFIR(44−122 μm) = 3.1 ± 0.1 × 10¹² L⊙. This LFIR is equivalent to LIR ≈ 6.2 ± 0.2 × 10¹² L⊙, given the typical difference between LFIR and LIR (Bell 2003). We note that the TMBB can be cooler if there is contamination of AGN to the radio flux. Based on Kennicutt’s conversion (Kennicutt 1998) for Chabrier IMF, this LIR from the modified black-body fitting corresponds to SFR = 620 ± 20 M⊙ yr−1, which is consistent with the SFR based on MAGPHYS. In addition, we obtain
 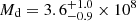 M⊙ through the modified black-body dust modelling, adopting the equation given in Hughes et al. (1997) and the absorption coefficient κd(125 μm) = 2.64 m2 kg−1 (Dunne et al. 2003). This Md from the modified black-body modelling is consistent with the Md by MAGPHYS.
MAGPHYS also provides us with a dust temperature of ASXDF1100.053.1,  K. Dudzevičiūtė et al. (2020) reported that there was a systematic offset between
  and the dust temperature determined by classical dust SED modelling using a modified black body,
  . The
. The 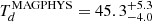 K for ASXDF1100.053.1 corresponds to
  K, which is consistent with the
  K, which we obtain by our fitting of a modified black-body SED described above.
3.2. Gas mass
We derived a gas mass for ASXDF1100.053.1 using the NOEMA CO(5–4) data. For ICO(5−4) = 0.54 ± 0.05 Jy km s−1, we find 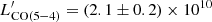 K km s−1 pc−2. At the same time we obtained
  , consistent with the linear relation between
  and LIR for local and z ∼ 1.5 galaxies found by Daddi et al. (2015),
  . This indicates that ASXDF1100.053.1 at z ≳ 5 has a similar nature to galaxies at lower redshift, in terms of its gas and dust. Adopting the
 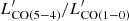 ratio of the composite CO spectral line energy distribution (SLED) of lensed SPT galaxies (Spilker et al. 2014, modulo concerns about differential lensing), we obtained an expected
 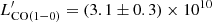 K km s−1 pc−2. Finally, we obtained Mgas = (3.1 ± 0.3)×1010 × α M⊙. Here, α is a CO luminosity-to-total molecular gas mass conversion factor. In this paper we adopt α = 1.0, which has been widely accepted for local and high-redshift dusty star-forming galaxies with LIR > 1012 L⊙ (e.g., Carilli & Walter 2013, and references therein; see also arguments in Ivison et al. 2011). This is consistent with recent measurements using ALMA at high redshift for submillimetre-selected galaxies on or above the so-called main sequence (Calistro Rivera et al. 2018).
There is a concern that the gas mass may have been underestimated because the gas density and excitation requirements of CO(5–4) mean it may not trace the entire gas distribution in a galaxy (e.g., Ivison et al. 2011). An independent gas mass estimate can be made using the dust mass, assuming a gas-to-dust mass ratio of 100, derived from CO(1–0) observations of high-redshift ALMA-identified SMGs (Ivison et al. 2011; Riechers et al. 2011; Bothwell et al. 2013; Swinbank et al. 2014, see also Scoville et al. 2014). We then obtained a gas mass of ∼4.4 × 10¹⁰ M⊙, which suggests that the gas mass from CO(5–4) flux has been modestly underestimated, by around 30%, but we note that the significant uncertainties on all these methods are often unappreciated.
3.3. Comparison with known SMGs
Firstly, we address what causes the optical, near-IR, and mid-IR faintness of ASXDF1100.053.1 by a comparison with the ∼700 ALMA-identified SCUBA-2 SMGs of Dudzevičiūtė et al. (2020). The mass-weighted age of ASXDF1100.053.1 is 2.9 × 10⁸ yr, shorter than the median for the Dudzevičiūtė et al. SMGs, 4.6 × 10⁸ yr. The median V-band dust attenuation for the Dudzevičiūtė et al. sample was AV = 2.89 ± 0.04 mag, with a 16–84th percentile range of AV = 1.89–4.24 mag, where ASXDF1100.053.1 has  mag, putting it amongst the top ∼15% in terms of reddening. Thus, our energy-coupled SED modelling suggests that ASXDF1100.053.1 is faint at optical, near-IR, and mid-IR wavelengths due to extreme reddening rather than mass-weighted age.
With  K, ASXDF1100.053.1 is typical for a ≈1 mm-selected SMG. Lensed SMGs at z = 2–6 show a mean of Td = 37.2 ± 8.2 K (Weiß et al. 2013), while the Dudzevičiūtė et al. (2020) SMGs at z ∼ 1–4 show a median of
 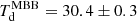 K with a 16–84th percentile range of 25.7–37.3 K. The Dudzevičiūtė et al. SMGs show no evolution of Td with redshift across z = 1–4. However, the dust temperatures of SMGs with zspec ≥ 5 (a mixture of far-IR luminous galaxies selected with SCUBA-2 at 0.85 mm, with Herschel at 250–500 μm, and with the South Pole Telescope at > 1 mm) are typically known to be higher than those at z ≲ 4 (e.g., Ivison et al. 2016). The Riechers et al. (2020) compilation of z ≥ 5 SMGs found a median value of Td = 52.7 ± 6.7 K, which they suggested has not been biased high by sample selection; instead, Riechers et al. attribute the higher Td to the fact that the majority of z ≥ 5 SMGs are likely to be starbursts, where the community seems to have largely accepted that SMGs at lower redshift are main-sequence galaxies, albeit typically at the more luminous extreme, with a large fraction of mergers and interactions (Engel et al. 2010). Therefore, ASXDF1100.053.1 appears to be a relatively rare massive main-sequence star-forming galaxy at z ≥ 5. However, the latest observational study of z ≳ 4 SMGs suggests they are also typically on the main sequence (Dudzevičiūtė et al. 2020), where the Riechers et al. results could perhaps suffer from selection effects.
The Dudzevičiūtė et al. SMGs have a median stellar mass Mstellar = (12.6 ± 0.5)×1010 M⊙, with a 16–84th percentile range of 5.9–22×1010 M⊙, with no evolution across z = 1–4, consistent with the values for AzTEC-selected SMGs in the GOODS-S and COSMOS fields (Yun et al. 2012; Miettinen et al. 2017a). The stellar mass of ASXDF1100.053.1,  M⊙, is in the top 16th percentile of the stellar mass distribution of the Dudzevičiūtė et al. SMGs. Looking in the literature for z ≥ 5 SMGs to compare with ASXDF1100.053.1, we find
 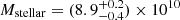 M⊙ for AzTEC-3 (Miettinen et al. 2017b),
 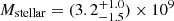 M⊙ for MAMBO-9 (Casey et al. 2019), and Mstellar = (1.2 ± 0.06)×1011 M⊙ for GN10 (Riechers et al. 2020). Thus, ASXDF1100.053.1 may be the most massive of the known SMGs at z ≥ 5. We again note that the stellar mass of all SMGs in this paper including these z > 5 SMGs, the Dudzevičiūtė et al. SMGs, and the Miettinen et al. (2017a) SMGs are estimated using MAGPHYS and assuming Chabrier’s IMF.
4. Possible late-stage post-starburst
Here we discuss the nature of the star formation in ASXDF1100.053.1, focusing on starburstiness, specific star formation rate, star formation rate, and gas-to-stellar mass ratio.
We start by characterising the nature of the star formation in ASXDF1100.053.1 in the context of the main sequence of galaxies. Adopting a main sequence that evolves with redshift (Speagle et al. 2014), we obtain an expected main-sequence SFR (SFRMS) of 760 M⊙ yr−1 at z = 5.2 for the stellar mass of ASXDF1100.053.1. We thus obtain a starburstiness ratio  , indicating that ASXDF1100.053.1 is on the main sequence at z = 5.2. Even assuming no evolution of the main sequence with redshift (i.e. assuming the same main sequence as seen at z = 2), ASXDF1100.053.1 shows
 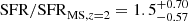 , supporting the notion that ASXDF1100.053.1 is a main-sequence star-forming galaxy rather than a starburst. Given that SMGs are thought to be amongst the dustiest, most intensely star-forming galaxies at any redshift, this then begs the question of whether there are any starbursts at z > 5 if they are defined on the basis of distance form the main sequence. If the most luminous are in fact dominated by accretion-related emission from AGN, as suspected (e.g., Ivison et al. 1998; Symeonidis & Page 2021), then it would appear unlikely.
For a more direct quantity to characterise ASXDF1100.053.1, we obtain a specific star formation rate (sSFR) of  yr−1. Such galaxies are usually considered to be on the main sequence.
Next, we focus on the gas-to-stellar mass ratio (μgas), and dust continuum, in order to probe the star formation in ASXDF1100.053.1. Adopting α = 1.0 for this SMG, we obtain μgas = 0.09, based on the values of Mgas and Mstellar described earlier. Tacconi et al. (2018) describes the typical μgas for main-sequence galaxies as a function of redshift, of Mstellar, and of sSFR. Given the measured Mstellar, the known redshift z = 5.24, and the expected position on the main sequence, we obtain an expected μgas of 0.5, which is approximately five times higher than the observed μgas. We note that the median of μgas for the Birkin et al. (2021) SMGs is also 0.5, indicating that the μgas of ASXDF1100.053.1 is approximately five times lower than the median of the SMGs.
We then obtain a gas-depletion time of 50 Myr for ASXDF1100.053.1, which is approximately four times lower than a typical value from the latest CO survey of ALMA-identified SMGs (Birkin et al. 2021), in which α = 1 is adopted consistently with our estimation (210 Myr), though such estimates for individual galaxies are always tentative given the range of plausible values of α and hence Mgas, the likelihood of feedback, and the possibility that starbursts have a radically different stellar IMF (e.g., Zhang et al. 2018) and hence wildly different SFRs, Mstellar, and so on. The gas depletion time of ASXDF1100.053.1 is also 15 times shorter than the expected value for the Tacconi et al. (2018) main sequence for the same stellar math and redshift.
We estimate a surface IR luminosity density ΣIR for ASXDF1100.053.1 from its ALMA continuum size, where the circularised effective radius  arcsec (Ikarashi et al. 2017b), corresponding to
  kpc at z = 5.24, meaning that
  L⊙ kpc−2.
To compare ASXDF1100.053.1 to other star-forming galaxies and SMGs at lower redshift, and other SMGs at z > 5, we show ASXDF1100.053.1 on plots of starburstiness (RSB = SFR/SFRMS) versus gas-mass fraction μgas and RSB versus gas-depletion time τdep (Fig. 4). We plot known unlensed SMGs at z > 5 with stellar mass estimates and gas masses determined from CO: AzTEC-3 (Capak et al. 2011; Riechers et al. 2014, 2020; Miettinen et al. 2017b), GN10 (Riechers et al. 2020), and MAMBO-9 (Casey et al. 2019); unlensed SMGs at z ∼ 2–4 (Ivison et al. 2011; Riechers et al. 2011; Calistro Rivera et al. 2018; Birkin et al. 2021). In addition, we add the Dudzevičiūtė et al. SMGs at z ∼ 2–4, for which we derive the gas mass from the dust mass assuming a gas-to-dust mass ratio of 100. We only plot z ∼ 2–4 SMGs with Mstellar≥10.5 M⊙.
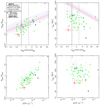 |
Fig. 4. Indicators of the nature of star formation of ASXDF1100.053.1 to compare with other known SMGs. Top: gas-mass fraction (μgas = Mgas/Mstellar) and starburstiness (RSB = SFR/SFRMS) (left), and gas-depletion time (τdep) and starburstiness (right). Bottom: gas-mass fraction and specific star formation rate (sSFR) (left), and gas-depletion time and starburstiness (right). The red star indicates ASXDF1100.053.1. The black, magenta, and orange stars are the z > 5 non-lensed SMGs with stellar mass estimates: AzTEC-3 (Miettinen et al. 2017b; Riechers et al. 2020), MAMBO-9 (Casey et al. 2019), and GN10 (Riechers et al. 2020). The grey, blue, and green stars are SMGs with CO observations at z ∼ 2–4 taken from Calistro Rivera et al. (2018) and Birkin et al. (2021), respectively. The small grey dots show ALMA-identified SMGs, sources at z ∼ 2–4 from Dudzevičiūtė et al. (2020); the gas masses of the Dudzevičiūtė et al. SMGs are derived from their dust masses assuming gas-to-dust mass ratio of 100. The vertical solid and dashed lines mark the main sequence (RSB = 1) and the threshold adopted for starbursts, RSB > 3. The SFR and the Mstellar of all the SMGs in this panel to be compared with ASXDF1100.053.1 were derived using MAGPHYS. The light blue shaded area shows the relation for main-sequence star-forming galaxies of Mstellar = 1010.5−11.5 M⊙ at z = 1.8–3.4 including 1σ scatter by the formulation in Tacconi et al. (2018). The red solid line shows the relation for main-sequence star-forming galaxies with Mstellar = 1011.5 M⊙ at z = 5.2 to be compared with ASXDF1100.053.1, together with expected 1σ scatter indicated by dashed lines. Here we adopt Chabrier’s IMF (Chabrier 2003) To discuss uncertainty in stellar mass estimation, and star formation rate, values based on stellar mass using Le Phare in Ikarashi et al. (2017b), and SFR based on the modified black-body fitting performed in Sect. 3.1 are indicated with a light red star with error bar. |
First, we compare ASXDF1100.053.1 with other known SMGs. While the μgas of ASXDF1100.053.1 is the lowest of the known SMGs, the location of ASXDF1100.053.1 on the RSB–μgas plot is consistent with the distribution of known SMGs; ASXDF1100.053.1 is located near the lowest edge of the μgas and RSB distribution of z ∼ 2–4 ALMA-identified SMGs with CO detections (Calistro Rivera et al. 2018; Birkin et al. 2021) and with gas masses estimated from their dust mass (Dudzevičiūtė et al. 2020). On the plot of RSB–τdep, ASXDF1100.053.1 is located at the lowest edge of the RSB and τdep distributions of known SMGs. When we see sSFR instead of RSB as a more direct physical property, the location of ASXDF1100.053.1 on the plots of sSFR–μgas and sSFR–τdep is also at the lowest edge of these distributions of known SMGs. This may indicate that ASXDF1100.053.1 is closer to passivisation than other SMGs, presumably the final phase of an SMG.
Second, we look at ASXDF1100.053.1 in the context of the other known z > 5 unlensed SMGs. In the literature we find three unlensed SMGs at z > 5 with stellar mass estimates: AzTEC-3, MAMBO-9, and GN10. AzTEC-3 and MAMBO-9 are located on the opposite side from ASXDF1100.053.1 in the two plots. AzTEC-3 and MAMBO-9 are starbursts with RSB ∼ 10–40. GN10 is located in the middle of ASXDF1100.053.1, AzTEC-3, and MAMBO-9, showing a value typical of lower-redshift SMGs. On the RSB–τdep plot, while ASXDF1100.053.1, GN10, and AzTEC-3 all have very low τdep, ASXDF1100.053.1 shows the lowest RSB. These plots also suggest, therefore, that ASXDF1100.053.1 is the closest to passivisation among the known z > 5 SMGs.
Lastly, when we see the various physical properties of ASXDF1100.053.1, including the low μgas, the short τdep, and RSB < 3, Re = 1.0 kpc and  L⊙ kpc−2, we find a similarity with the ALMA-detected main-sequence galaxies at z ∼ 2, which are suggested to be at the late stage of star formation prior to passivisation in Elbaz et al. (2018).
At the bottom of this section, we briefly show how the values in Fig. 4 for ASXDF1100.053.1 can vary when we adopt non-energy-coupled SED modelling using stellar mass and star formation rate based on Le Phare obtained in Ikarashi et al. (2017b) and the modified black-body modelling of dust emission obtained in Sect. 3.1. The value for this case in each panel is displayed with a light red star in Fig. 4. In this case, RSB is a little bit higher than that by MAGPHYS, and the RSB also indicates that ASXDF1100.053.1 is on the main sequence. Together with this fact, considering the potential underestimation of stellar mass due to the lack of λrest > 1 μm photometry and the RSB by MAGPHYS, ASXDF1100.053.1 is very likely on the main sequence at z = 5.2, supporting the discussion described above.
5. Possible more massive galaxy formation at z > 5
Here we compare the volume density of known bright SMGs at z > 5, including ASXDF1100.053.1 at z = 5.24, with the latest model predictions. We consider all known unlensed SMGs at z = 5.0–5.5, including HDF850.1 at z = 5.183 (Walter et al. 2012) and GN10 (Riechers et al. 2020), both in the Hubble Deep Field North or GOODS-N, AzTEC-3 at z = 5.298 (Capak et al. 2011) and ASXDF1100.053.1. The respective flux densities F1100 μm of ASXDF1100.053.1 and AzTEC-3 are 3.5 mJy (Ikarashi et al. 2017b) and 6.2 mJy (at 1 mm; Riechers et al. 2014). HDF850.1 has F870 μm = 8.2 mJy (Cowie et al. 2009) and F1300 μm = 2.2 mJy (Downes et al. 1999) and its 1100 μm flux density is expected to be 4.3 mJy. GN10 has F1200 μm = 5.25 mJy and F995 μm = 9.55 (Riechers et al. 2020). Therefore, all known unlensed SMGs are > 3 mJy at 1100 μm.
Figure 5 shows the redshift source number density along with redshift per deg−2 for the known (very likely) unlensed SMGs with F1100 μm ≥ 3 mJy in comparison with model predictions for galaxies with F1100 μm ≥ 3 mJy from the latest semi-analytic cosmological model, Galform (Cowley et al. 2015; Lacey et al. 2016) and a semi-empirical model based on 3D hydrodynamical simulations and 3D dust radiative transfer (Hayward et al. 2013). The latest Galform model predicts the 1100 μm flux density for each mock galaxy. Hayward et al. (2013) predicted the redshift distribution of SMGs for two thresholds, F1100 μm ≥ 1 or 4 mJy. We draw the curve in Fig. 5 by applying the model for F1100 μm ≥ 4 mJy to the observed number of F1100 μm ≥ 3 mJy ALMA-identified AzTEC SMGs (Ikarashi et al. 2017a). In the redshift source number density calculation, we consider a total surveyed area of 1.1 deg2 for the four SMGs. For ASXDF1100.053.1, we adopt 1200 arcmin2, which is the size of the parent AzTEC/ASTE 1100 μm map (Ikarashi et al. 2013). For HDF850.1 and GN10, the size of the HDF-N SCUBA super-map (Borys et al. 2003) 165 arcmin2 is adopted. For AzTEC 3, the map size of AzTEC/ASTE 1100 μm map in COSMOS, 0.72 deg2 (Aretxaga et al. 2011) is adopted. Poissonian errors are considered for error bars. The Galform simulation indicates that field-to-field variations should be a minor effect, and Poisson errors dominate in the case of SMGs (Cowley et al. 2015). In addition, in order to make a comparison with the redshift source number density of the spectroscopically confirmed z ≥ 5 SMGs, we draw the expected source number density of F1100 μm ≥ 3 mJy SMGs based on the sum of photometric redshift probability densities of the AS2UDS SMGs (Dudzevičiūtė et al. 2020). Here we assume a constant flux ratio, F870 μm/F1100 μm = 1.8.
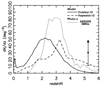 |
Fig. 5. Redshift source number density of SMGs at z ≳ 5. The black dot and arrow indicate a redshift source number density of z = 5.1–5.3 non-lensed SMGs with 1σ error, derived from known SMGs in the literature (HDF850.1, GN10, and AzTEC-3) and ASXDF1100.053.1, confirmed by this study. The curved lines show redshift source number density distribution from simulations and a photometric redshift study. The solid curve shows a prediction for F1100 μm ≥ 3 mJy SMGs by Galform (Cowley et al. 2015). The dashed curve shows another prediction for F1100 μm ≥ 3 SMGs by Hayward et al. (2013). Here the distribution is derived by applying the number of F1100 μm ≥ 3 ALMA-identified AzTEC SMGs (Ikarashi et al. 2017a) to the prediction in the simulation for flux density closest to the F1100 μm ≥ 3 criterion. The dotted curve shows a sum of redshift probability density for each AS2UDS SMGs with F1100 μm ≥ 3 (Dudzevičiūtė et al. 2020). |
The redshift source number density of the known unlensed bright SMGs at zspec = 5.1–5.3 is dN/dz = 30.4 ± 19.0 deg−2. Given that not all of the bright SMGs in the parent sample have a spectroscopic redshift, this final redshift source number density can increase. The predicted source number densities of the latest Galform and the Hayward models are 1.3 and 13.8, respectively; thus, the current spectroscopically confirmed source number density is higher than these model predictions, with significance levels of 1.5 and 0.9σ, respectively. As illustrated in Fig. 5, recent photometric redshift studies of hundreds of ALMA-identified SCUBA-2 SMGs reported a positive evolution of observed 870 μm flux density with redshift (Stach et al. 2019; Simpson et al. 2020, as first hinted by Ivison et al. 2007), which is not seen in the Galform model. These photometric redshift studies and the Hayward model suggested that bright SMGs tend to be at higher redshift, perhaps due to ‘downsizing’. A comparison of the redshift source number density at z = 5.1–5.3 based on spectroscopic redshift with these studies suggests that the redshift evolution of submillimetre flux as a proxy of IR luminosity can evolve more strongly than these photometric redshift studies and simulations suggested.
6. Summary
In order to obtain a spectroscopic redshift, we conducted wide-band blind 1 and 3 mm scans using NOEMA to cover a contiguous 31 GHz block in each waveband towards the optically dark z > 5 candidate, the unlensed ALMA-identified AzTEC SMG with F1100 μm = 3.5 mJy, ASXDF1100.053.1. In the NOEMA spectral scan of ASXDF1100.053.1, we robustly detect lines of CO(5–4) and CO(6–5), showing unambiguously that zspec = 5.2383 ± 0.0005.
An energy-coupled SED analysis of ASXDF1100.053.1, from optical to radio wavelengths, then indicates that 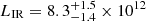 L⊙, SFR
 M⊙ yr−1,
 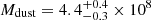 M⊙,
M⊙, 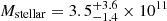 M⊙, and Td = 35
 K. We also obtain Mgas = (3.1 ± 0.3)×1010 M⊙ from the CO(5–4) line luminosity.
ASXDF1100.053.1 has a low starburstiness of RSB = 0.58, a low sSFR of  ,yr−1, a low gas-to-stellar mass ratio μgas of 0.08, and a low gas-depletion time (τdep) of 50 Myr. On plots of RSB–μgas, RSB–τdep, sSFR–μgas, and sSFR–τdep, ASXDF1100.053.1 is located at the lowest edge of the known z < 5 SMGs, indicating that it is likely a late-stage dusty starburst prior to passivisation. Among the known unlensed z > 5 SMGs, the location of ASXDF1100.053.1 suggests that it is the closest to passivisation.
In combination with the known unlensed z = 5.1–5.3 SMGs, we obtain the redshift source number density, dN/dz = 30.4 ± 19.0 deg−2. Redshift confirmation of z > 5 candidate SMGs is incomplete, so the source number density could be higher. Given that the latest cosmological simulations predict dN/dz = 1–14 deg−2, this observed source number density suggests that massive galaxy formation may have happened earlier than suggested by current models.
Acknowledgments
S. I. acknowledges financial support from STFC (ST/T000244/1), and the Netherlands Organization for Scientific Research (NWO) through the Top Grant Project 614.001.403 and Vidi grant No. 639.042.423. R. I. J. was funded by the Deutsche Forschungsgemeinschaft (DFG, German Research Foundation) under Germany’s Excellence Strategy – EXC-2094 – 390783311. K.K. ackhowledges the JSPS KAKENHI Grant Number JP17H06130 and the NAOJ ALMA Scientific Research Grant Number 2017-06B. This work is based on observations carried out under project number W17ES, W18EX, and W19EA with the IRAM NOEMA Interferometer. IRAM is supported by INSU/CNRS (France), MPG (Germany) and IGN (Spain). The research leading to these results has received funding from the European Union’s Horizon 2020 research and innovation program under grant agreement No 730562 [RadioNet].
References
- Aretxaga, I., Wilson, G. W., Aguilar, E., et al. 2011, MNRAS, 415, 3831 [Google Scholar]
- Baugh, C. M., Lacey, C. G., Frenk, C. S., et al. 2005, MNRAS, 356, 1191 [Google Scholar]
- Bell, E. F. 2003, ApJ, 586, 794 [Google Scholar]
- Béthermin, M., Wu, H.-Y., Lagache, G., et al. 2017, A&A, 607, A89 [Google Scholar]
- Birkin, J. E., Weiss, A., Wardlow, J. L., et al. 2021, MNRAS, 501, 3926 [Google Scholar]
- Blain, A. W., & Longair, M. S. 1993, MNRAS, 264, 509 [Google Scholar]
- Borys, C., Chapman, S., Halpern, M., & Scott, D. 2003, MNRAS, 344, 385 [NASA ADS] [CrossRef] [Google Scholar]
- Bothwell, M. S., Smail, I., Chapman, S. C., et al. 2013, MNRAS, 429, 3047 [Google Scholar]
- Calistro Rivera, G., Hodge, J. A., Smail, I., et al. 2018, ApJ, 863, 56 [Google Scholar]
- Capak, P. L., Riechers, D., Scoville, N. Z., et al. 2011, Nature, 470, 233 [Google Scholar]
- Carilli, C. L., & Walter, F. 2013, ARA&A, 51, 105 [NASA ADS] [CrossRef] [Google Scholar]
- Casey, C. M., Zavala, J. A., Aravena, M., et al. 2019, ApJ, 887, 55 [Google Scholar]
- Chabrier, G. 2003, PASP, 115, 763 [Google Scholar]
- Chapman, S. C., Blain, A. W., Smail, I., & Ivison, R. J. 2005, ApJ, 622, 772 [NASA ADS] [CrossRef] [Google Scholar]
- Chen, C.-C., Smail, I., Swinbank, A. M., et al. 2015, ApJ, 799, 194 [NASA ADS] [CrossRef] [Google Scholar]
- Condon, J. J. 1992, ARA&A, 30, 575 [Google Scholar]
- Cooke, E. A., Smail, I., Swinbank, A. M., et al. 2018, ApJ, 861, 100 [Google Scholar]
- Cowie, L. L., Barger, A. J., Wang, W. H., & Williams, J. P. 2009, ApJ, 697, L122 [NASA ADS] [CrossRef] [Google Scholar]
- Cowie, L. L., González-López, J., Barger, A. J., et al. 2018, ApJ, 865, 106 [NASA ADS] [CrossRef] [Google Scholar]
- Cowley, W. I., Lacey, C. G., Baugh, C. M., & Cole, S. 2015, MNRAS, 446, 1784 [Google Scholar]
- da Cunha, E., Charlot, S., & Elbaz, D. 2008, MNRAS, 388, 1595 [Google Scholar]
- da Cunha, E., Groves, B., Walter, F., et al. 2013, ApJ, 766, 13 [Google Scholar]
- da Cunha, E., Walter, F., Smail, I. R., et al. 2015, ApJ, 806, 110 [Google Scholar]
- Daddi, E., Dannerbauer, H., Liu, D., et al. 2015, A&A, 577, A46 [NASA ADS] [CrossRef] [EDP Sciences] [Google Scholar]
- Dale, D. A., & Helou, G. 2002, ApJ, 576, 159 [Google Scholar]
- Danielson, A. L. R., Swinbank, A. M., Smail, I., et al. 2017, ApJ, 840, 78 [NASA ADS] [CrossRef] [Google Scholar]
- Downes, D., Neri, R., Greve, A., et al. 1999, A&A, 347, 809 [NASA ADS] [Google Scholar]
- Dudzevičiūtė, U., Smail, I., Swinbank, A. M., et al. 2020, MNRAS, 494, 3828 [Google Scholar]
- Dunne, L., Eales, S. A., & Edmunds, M. G. 2003, MNRAS, 341, 589 [NASA ADS] [CrossRef] [Google Scholar]
- Eales, S., Lilly, S., Gear, W., et al. 1999, ApJ, 515, 518 [NASA ADS] [CrossRef] [Google Scholar]
- Elbaz, D., Leiton, R., Nagar, N., et al. 2018, A&A, 616, A110 [NASA ADS] [CrossRef] [EDP Sciences] [Google Scholar]
- Engel, H., Tacconi, L. J., Davies, R. I., et al. 2010, ApJ, 724, 233 [NASA ADS] [CrossRef] [Google Scholar]
- Gruppioni, C., Béthermin, M., Loiacono, F., et al. 2020, A&A, 643, A8 [NASA ADS] [CrossRef] [EDP Sciences] [Google Scholar]
- Hainline, L. J., Blain, A. W., Smail, I., et al. 2011, ApJ, 740, 96 [NASA ADS] [CrossRef] [Google Scholar]
- Hayward, C. C., Narayanan, D., Kereš, D., et al. 2013, MNRAS, 428, 2529 [Google Scholar]
- Hodge, J. A., Karim, A., Smail, I., et al. 2013, ApJ, 768, 91 [Google Scholar]
- Hodge, J. A., Smail, I., Walter, F., et al. 2019, ApJ, 876, 130 [Google Scholar]
- Hopkins, P. F., Hernquist, L., Cox, T. J., & Kereš, D. 2008, ApJS, 175, 356 [Google Scholar]
- Hughes, D. H., Dunlop, J. S., & Rawlings, S. 1997, MNRAS, 289, 766 [NASA ADS] [CrossRef] [Google Scholar]
- Hughes, D. H., Serjeant, S., Dunlop, J., et al. 1998, Nature, 394, 241 [Google Scholar]
- Ikarashi, S., Kohno, K., Aretxaga, I., et al. 2013, in AzTEC/ASTE Deep and Wide Submillimeter Galaxy Survey in the Subaru/XMM-Newton Deep Field: Identification of VLA, Spitzer and Herschel Counterparts to 1100-μm-Selected Galaxies and Redshifts, eds. R. Kawabe, N. Kuno, S. Yamamoto, ASP Conf. Ser., 476, 265 [Google Scholar]
- Ikarashi, S., Ivison, R. J., Caputi, K. I., et al. 2015, ApJ, 810, 133 [Google Scholar]
- Ikarashi, S., Caputi, K. I., Ohta, K., et al. 2017a, ApJ, 849, L36 [Google Scholar]
- Ikarashi, S., Ivison, R. J., Caputi, K. I., et al. 2017b, ApJ, 835, 286 [NASA ADS] [CrossRef] [Google Scholar]
- Ilbert, O., Arnouts, S., McCracken, H. J., et al. 2006, A&A, 457, 841 [NASA ADS] [CrossRef] [EDP Sciences] [Google Scholar]
- Ivison, R. J., Smail, I., Le Borgne, J. F., et al. 1998, MNRAS, 298, 583 [NASA ADS] [CrossRef] [Google Scholar]
- Ivison, R. J., Greve, T. R., Dunlop, J. S., et al. 2007, MNRAS, 380, 199 [Google Scholar]
- Ivison, R. J., Papadopoulos, P. P., Smail, I., et al. 2011, MNRAS, 412, 1913 [Google Scholar]
- Ivison, R. J., Lewis, A. J. R., Weiss, A., et al. 2016, ApJ, 832, 78 [Google Scholar]
- Ivison, R. J., Page, M. J., Cirasuolo, M., et al. 2019, MNRAS, 489, 427 [NASA ADS] [CrossRef] [Google Scholar]
- Kennicutt, R. C., Jr. 1998, ARA&A, 36, 189 [Google Scholar]
- Kirkpatrick, A., Pope, A., Sajina, A., et al. 2015, ApJ, 814, 9 [NASA ADS] [CrossRef] [Google Scholar]
- Lacey, C. G., Baugh, C. M., Frenk, C. S., et al. 2016, MNRAS, 462, 3854 [Google Scholar]
- Laigle, C., McCracken, H. J., Ilbert, O., et al. 2016, ApJS, 224, 24 [Google Scholar]
- Madau, P., & Dickinson, M. 2014, ARA&A, 52, 415 [Google Scholar]
- Maraston, C., Daddi, E., Renzini, A., et al. 2006, ApJ, 652, 85 [NASA ADS] [CrossRef] [Google Scholar]
- McAlpine, S., Smail, I., Bower, R. G., et al. 2019, MNRAS, 488, 2440 [NASA ADS] [CrossRef] [Google Scholar]
- Merlin, E., Fortuni, F., Torelli, M., et al. 2019, MNRAS, 490, 3309 [CrossRef] [Google Scholar]
- Michałowski, M. J., Hayward, C. C., Dunlop, J. S., et al. 2014, A&A, 571, A75 [NASA ADS] [CrossRef] [EDP Sciences] [Google Scholar]
- Miettinen, O., Delvecchio, I., Smolčić, V., et al. 2017a, A&A, 606, A17 [NASA ADS] [CrossRef] [EDP Sciences] [Google Scholar]
- Miettinen, O., Delvecchio, I., Smolčić, V., et al. 2017b, A&A, 597, A5 [NASA ADS] [CrossRef] [EDP Sciences] [Google Scholar]
- Netzer, H., Lutz, D., Schweitzer, M., et al. 2007, ApJ, 666, 806 [NASA ADS] [CrossRef] [Google Scholar]
- Pforr, J., Maraston, C., & Tonini, C. 2012, MNRAS, 422, 3285 [NASA ADS] [CrossRef] [Google Scholar]
- Pillepich, A., Springel, V., Nelson, D., et al. 2018, MNRAS, 473, 4077 [Google Scholar]
- Reuter, C., Vieira, J. D., Spilker, J. S., et al. 2020, ApJ, 902, 78 [NASA ADS] [CrossRef] [Google Scholar]
- Riechers, D. A., Carilli, L. C., Walter, F., et al. 2011, ApJ, 733, L11 [Google Scholar]
- Riechers, D. A., Carilli, C. L., Capak, P. L., et al. 2014, ApJ, 796, 84 [Google Scholar]
- Riechers, D. A., Hodge, J. A., Pavesi, R., et al. 2020, ApJ, 895, 81 [Google Scholar]
- Sanders, D. B., Soifer, B. T., Elias, J. H., et al. 1988, ApJ, 325, 74 [Google Scholar]
- Santini, P., Merlin, E., Fontana, A., et al. 2019, MNRAS, 486, 560 [NASA ADS] [CrossRef] [Google Scholar]
- Schreiber, C., Glazebrook, K., Nanayakkara, T., et al. 2018, A&A, 618, A85 [NASA ADS] [CrossRef] [EDP Sciences] [Google Scholar]
- Scoville, N., Aussel, H., Sheth, K., et al. 2014, ApJ, 783, 84 [CrossRef] [Google Scholar]
- Simpson, J. M., Swinbank, A. M., Smail, I., et al. 2014, ApJ, 788, 125 [Google Scholar]
- Simpson, J. M., Smail, I., Swinbank, A. M., et al. 2015, ApJ, 799, 81 [CrossRef] [Google Scholar]
- Simpson, J. M., Smail, I., Dudzevičiūtė, U., et al. 2020, MNRAS, 495, 3409 [Google Scholar]
- Smail, I., Ivison, R. J., & Blain, A. W. 1997, ApJ, 490, L5 [NASA ADS] [CrossRef] [Google Scholar]
- Smail, I., Dudzevičiūtė, U., Stach, S. M., et al. 2021, MNRAS, 502, 3426 [NASA ADS] [CrossRef] [Google Scholar]
- Smolčić, V., Aravena, M., Navarrete, F., et al. 2012, A&A, 548, A4 [NASA ADS] [CrossRef] [EDP Sciences] [Google Scholar]
- Speagle, J. S., Steinhardt, C. L., Capak, P. L., & Silverman, J. D. 2014, ApJS, 214, 15 [Google Scholar]
- Spilker, J. S., Marrone, D. P., Aguirre, J. E., et al. 2014, ApJ, 785, 149 [NASA ADS] [CrossRef] [Google Scholar]
- Stacey, G. J., Hailey-Dunsheath, S., Ferkinhoff, C., et al. 2010, ApJ, 724, 957 [NASA ADS] [CrossRef] [Google Scholar]
- Stach, S. M., Dudzevičiūtė, U., Smail, I., et al. 2019, MNRAS, 487, 4648 [Google Scholar]
- Stanley, F., Harrison, C. M., Alexander, D. M., et al. 2018, MNRAS, 478, 3721 [NASA ADS] [CrossRef] [Google Scholar]
- Straatman, C. M. S., Labbé, I., Spitler, L. R., et al. 2015, ApJ, 808, L29 [Google Scholar]
- Swinbank, A. M., Karim, A., Smail, I., et al. 2012, MNRAS, 427, 1066 [Google Scholar]
- Swinbank, A. M., Simpson, J. M., Smail, I., et al. 2014, MNRAS, 438, 1267 [Google Scholar]
- Symeonidis, M., & Page, M. J. 2021, MNRAS, 503, 3992 [NASA ADS] [CrossRef] [Google Scholar]
- Tacconi, L. J., Genzel, R., Saintonge, A., et al. 2018, ApJ, 853, 179 [Google Scholar]
- Toft, S., Smolčić, V., Magnelli, B., et al. 2014, ApJ, 782, 68 [Google Scholar]
- Vieira, J. D., Marrone, D. P., Chapman, S. C., et al. 2013, Nature, 495, 344 [Google Scholar]
- Walter, F., Decarli, R., Carilli, C., et al. 2012, Nature, 486, 233 [Google Scholar]
- Wang, T., Schreiber, C., Elbaz, D., et al. 2019, Nature, 572, 211 [Google Scholar]
- Weiß, A., De Breuck, C., Marrone, D. P., et al. 2013, ApJ, 767, 88 [Google Scholar]
- Williams, C. C., Labbe, I., Spilker, J., et al. 2019, ApJ, 884, 154 [Google Scholar]
- Younger, J. D., Fazio, G. G., Huang, J.-S., et al. 2007, ApJ, 671, 1531 [NASA ADS] [CrossRef] [Google Scholar]
- Younger, J. D., Fazio, G. G., Huang, J.-S., et al. 2009, ApJ, 704, 803 [NASA ADS] [CrossRef] [Google Scholar]
- Yun, M. S., Reddy, N. A., & Condon, J. J. 2001, ApJ, 554, 803 [Google Scholar]
- Yun, M. S., Scott, K. S., Guo, Y., et al. 2012, MNRAS, 420, 957 [NASA ADS] [CrossRef] [Google Scholar]
- Zhang, Z.-Y., Papadopoulos, P. P., Ivison, R. J., et al. 2016, R. Soc. Open Sci., 3, 160025 [Google Scholar]
- Zhang, Z.-Y., Romano, D., Ivison, R. J., Papadopoulos, P. P., & Matteucci, F. 2018, Nature, 558, 260 [Google Scholar]
All Tables
All Figures
|
Fig. 1. Composite spectrum of ASXDF1100.053.1, covering from 80.4 to 111.3 GHz after combining all our NOEMA scans at 3 mm. Continuum emission has been subtracted. The spectral resolution is 30 MHz, which corresponds to 97 km s−1 and 81 km s−1 at 92.4 GHz for CO(5–4) and at 110.8 GHz for CO(6–5), respectively. |
| In the text | |
|
Fig. 2. CO(5–4), CO(6–5), 3 mm continuum, and 1 mm continuum images of ASXDF1100.053.1. Contour levels are plotted at ±2.5, 5.0, 7.5, and 10σ. The respective rms levels are 79, 130, 8.9, and 63 μJy beam−1. Respective synthesised beams of the CO(5–4), CO(6–5), 3 mm continuum, and 1 mm continuum images are 4″.3 × 1″.5 at a position angle (PA) of 6.0°, 3″.5 × 1″.2 (PA 5.8°), 4″.2 × 1″.6 (PA 7.7°), and 2″.1 × 0″.7 (PA 10.3°). |
| In the text | |
|
Fig. 3. Spectral energy distribution of ASXDF1100.053.1 in the observed frame. Red filled and open squares indicate the measured detections and upper limits, respectively, taken from this paper or from Ikarashi et al. (2017b). A solid black curve shows the best-fit SED obtained by our modelling using MAGPHYS in Sect. 3.1. A dashed blue curve shows the best-fit dust SED obtained by another modelling using modified black bodies with β = 1.8 including radio SED, which is presented in Sect. 3.1. The physical properties of the best-fit SED are not identical to the median values shown in Table 2. |
| In the text | |
|
Fig. 4. Indicators of the nature of star formation of ASXDF1100.053.1 to compare with other known SMGs. Top: gas-mass fraction (μgas = Mgas/Mstellar) and starburstiness (RSB = SFR/SFRMS) (left), and gas-depletion time (τdep) and starburstiness (right). Bottom: gas-mass fraction and specific star formation rate (sSFR) (left), and gas-depletion time and starburstiness (right). The red star indicates ASXDF1100.053.1. The black, magenta, and orange stars are the z > 5 non-lensed SMGs with stellar mass estimates: AzTEC-3 (Miettinen et al. 2017b; Riechers et al. 2020), MAMBO-9 (Casey et al. 2019), and GN10 (Riechers et al. 2020). The grey, blue, and green stars are SMGs with CO observations at z ∼ 2–4 taken from Calistro Rivera et al. (2018) and Birkin et al. (2021), respectively. The small grey dots show ALMA-identified SMGs, sources at z ∼ 2–4 from Dudzevičiūtė et al. (2020); the gas masses of the Dudzevičiūtė et al. SMGs are derived from their dust masses assuming gas-to-dust mass ratio of 100. The vertical solid and dashed lines mark the main sequence (RSB = 1) and the threshold adopted for starbursts, RSB > 3. The SFR and the Mstellar of all the SMGs in this panel to be compared with ASXDF1100.053.1 were derived using MAGPHYS. The light blue shaded area shows the relation for main-sequence star-forming galaxies of Mstellar = 1010.5−11.5 M⊙ at z = 1.8–3.4 including 1σ scatter by the formulation in Tacconi et al. (2018). The red solid line shows the relation for main-sequence star-forming galaxies with Mstellar = 1011.5 M⊙ at z = 5.2 to be compared with ASXDF1100.053.1, together with expected 1σ scatter indicated by dashed lines. Here we adopt Chabrier’s IMF (Chabrier 2003) To discuss uncertainty in stellar mass estimation, and star formation rate, values based on stellar mass using Le Phare in Ikarashi et al. (2017b), and SFR based on the modified black-body fitting performed in Sect. 3.1 are indicated with a light red star with error bar. |
| In the text | |
|
Fig. 5. Redshift source number density of SMGs at z ≳ 5. The black dot and arrow indicate a redshift source number density of z = 5.1–5.3 non-lensed SMGs with 1σ error, derived from known SMGs in the literature (HDF850.1, GN10, and AzTEC-3) and ASXDF1100.053.1, confirmed by this study. The curved lines show redshift source number density distribution from simulations and a photometric redshift study. The solid curve shows a prediction for F1100 μm ≥ 3 mJy SMGs by Galform (Cowley et al. 2015). The dashed curve shows another prediction for F1100 μm ≥ 3 SMGs by Hayward et al. (2013). Here the distribution is derived by applying the number of F1100 μm ≥ 3 ALMA-identified AzTEC SMGs (Ikarashi et al. 2017a) to the prediction in the simulation for flux density closest to the F1100 μm ≥ 3 criterion. The dotted curve shows a sum of redshift probability density for each AS2UDS SMGs with F1100 μm ≥ 3 (Dudzevičiūtė et al. 2020). |
| In the text | |
Current usage metrics show cumulative count of Article Views (full-text article views including HTML views, PDF and ePub downloads, according to the available data) and Abstracts Views on Vision4Press platform.
Data correspond to usage on the plateform after 2015. The current usage metrics is available 48-96 hours after online publication and is updated daily on week days.
Initial download of the metrics may take a while.