Fig. 4.
Download original image
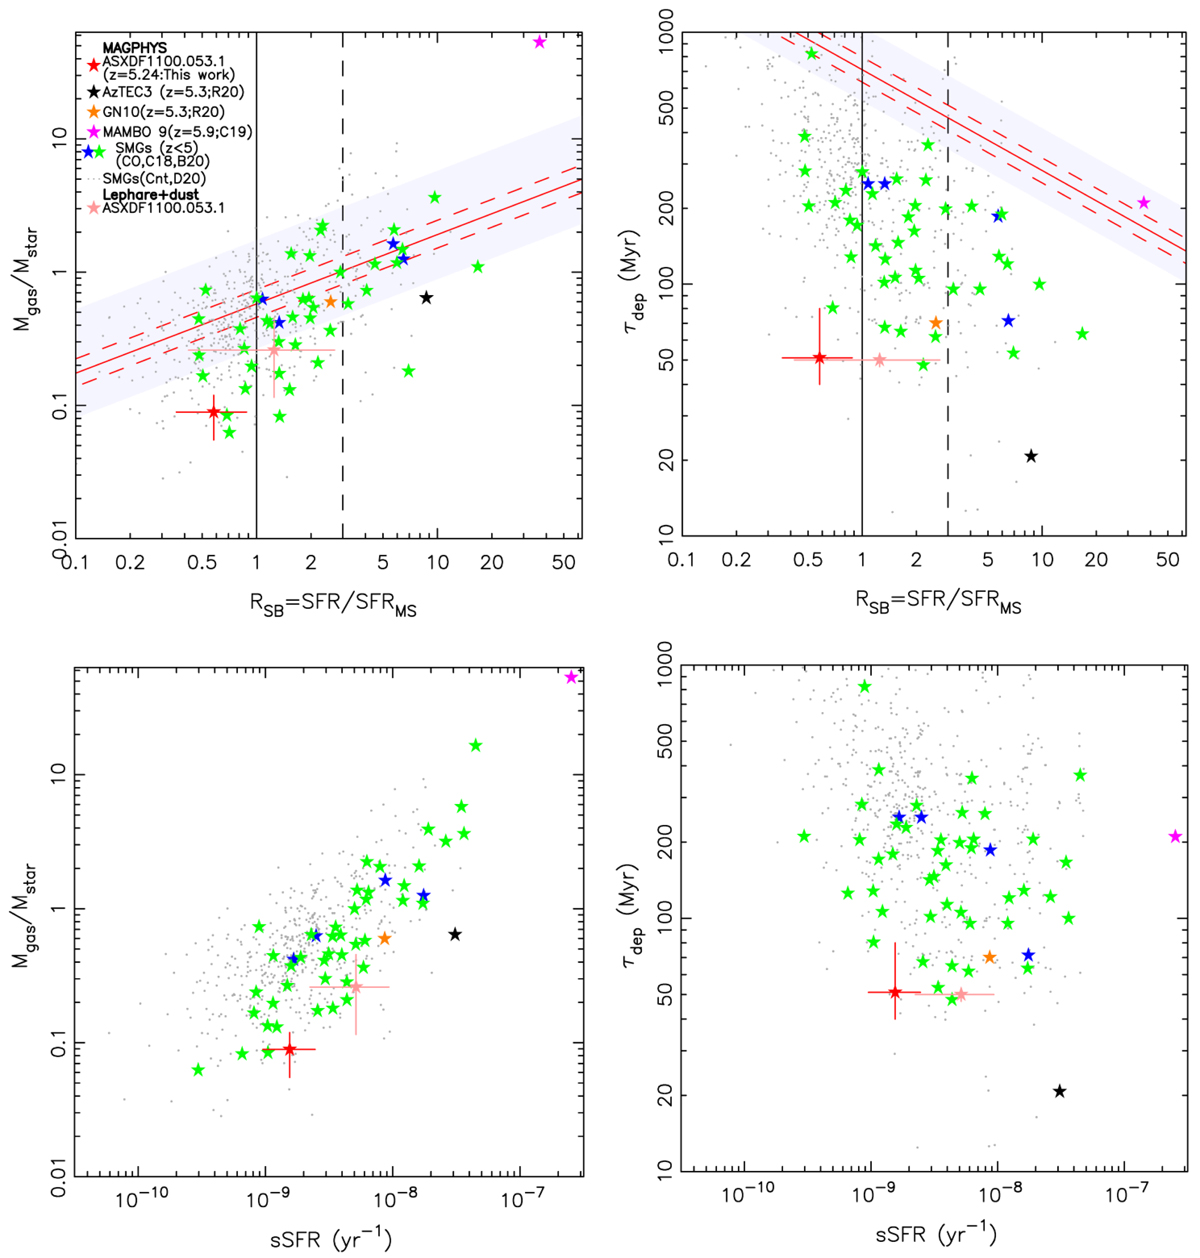
Indicators of the nature of star formation of ASXDF1100.053.1 to compare with other known SMGs. Top: gas-mass fraction (μgas = Mgas/Mstellar) and starburstiness (RSB = SFR/SFRMS) (left), and gas-depletion time (τdep) and starburstiness (right). Bottom: gas-mass fraction and specific star formation rate (sSFR) (left), and gas-depletion time and starburstiness (right). The red star indicates ASXDF1100.053.1. The black, magenta, and orange stars are the z > 5 non-lensed SMGs with stellar mass estimates: AzTEC-3 (Miettinen et al. 2017b; Riechers et al. 2020), MAMBO-9 (Casey et al. 2019), and GN10 (Riechers et al. 2020). The grey, blue, and green stars are SMGs with CO observations at z ∼ 2–4 taken from Calistro Rivera et al. (2018) and Birkin et al. (2021), respectively. The small grey dots show ALMA-identified SMGs, sources at z ∼ 2–4 from Dudzevičiūtė et al. (2020); the gas masses of the Dudzevičiūtė et al. SMGs are derived from their dust masses assuming gas-to-dust mass ratio of 100. The vertical solid and dashed lines mark the main sequence (RSB = 1) and the threshold adopted for starbursts, RSB > 3. The SFR and the Mstellar of all the SMGs in this panel to be compared with ASXDF1100.053.1 were derived using MAGPHYS. The light blue shaded area shows the relation for main-sequence star-forming galaxies of Mstellar = 1010.5−11.5 M⊙ at z = 1.8–3.4 including 1σ scatter by the formulation in Tacconi et al. (2018). The red solid line shows the relation for main-sequence star-forming galaxies with Mstellar = 1011.5 M⊙ at z = 5.2 to be compared with ASXDF1100.053.1, together with expected 1σ scatter indicated by dashed lines. Here we adopt Chabrier’s IMF (Chabrier 2003) To discuss uncertainty in stellar mass estimation, and star formation rate, values based on stellar mass using Le Phare in Ikarashi et al. (2017b), and SFR based on the modified black-body fitting performed in Sect. 3.1 are indicated with a light red star with error bar.
Current usage metrics show cumulative count of Article Views (full-text article views including HTML views, PDF and ePub downloads, according to the available data) and Abstracts Views on Vision4Press platform.
Data correspond to usage on the plateform after 2015. The current usage metrics is available 48-96 hours after online publication and is updated daily on week days.
Initial download of the metrics may take a while.