Fig. 3.

Download original image
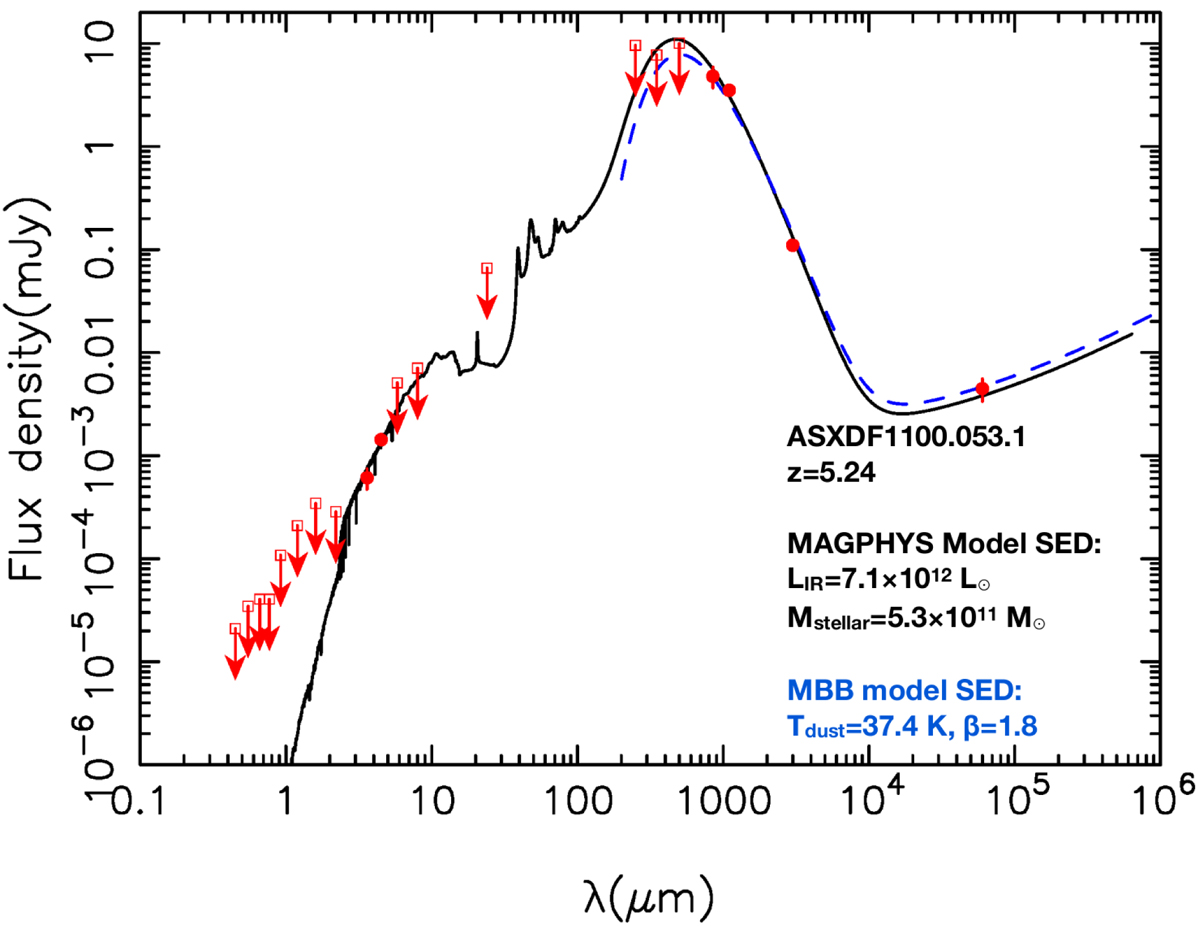
Spectral energy distribution of ASXDF1100.053.1 in the observed frame. Red filled and open squares indicate the measured detections and upper limits, respectively, taken from this paper or from Ikarashi et al. (2017b). A solid black curve shows the best-fit SED obtained by our modelling using MAGPHYS in Sect. 3.1. A dashed blue curve shows the best-fit dust SED obtained by another modelling using modified black bodies with β = 1.8 including radio SED, which is presented in Sect. 3.1. The physical properties of the best-fit SED are not identical to the median values shown in Table 2.
Current usage metrics show cumulative count of Article Views (full-text article views including HTML views, PDF and ePub downloads, according to the available data) and Abstracts Views on Vision4Press platform.
Data correspond to usage on the plateform after 2015. The current usage metrics is available 48-96 hours after online publication and is updated daily on week days.
Initial download of the metrics may take a while.


