Fig. 2.
Download original image
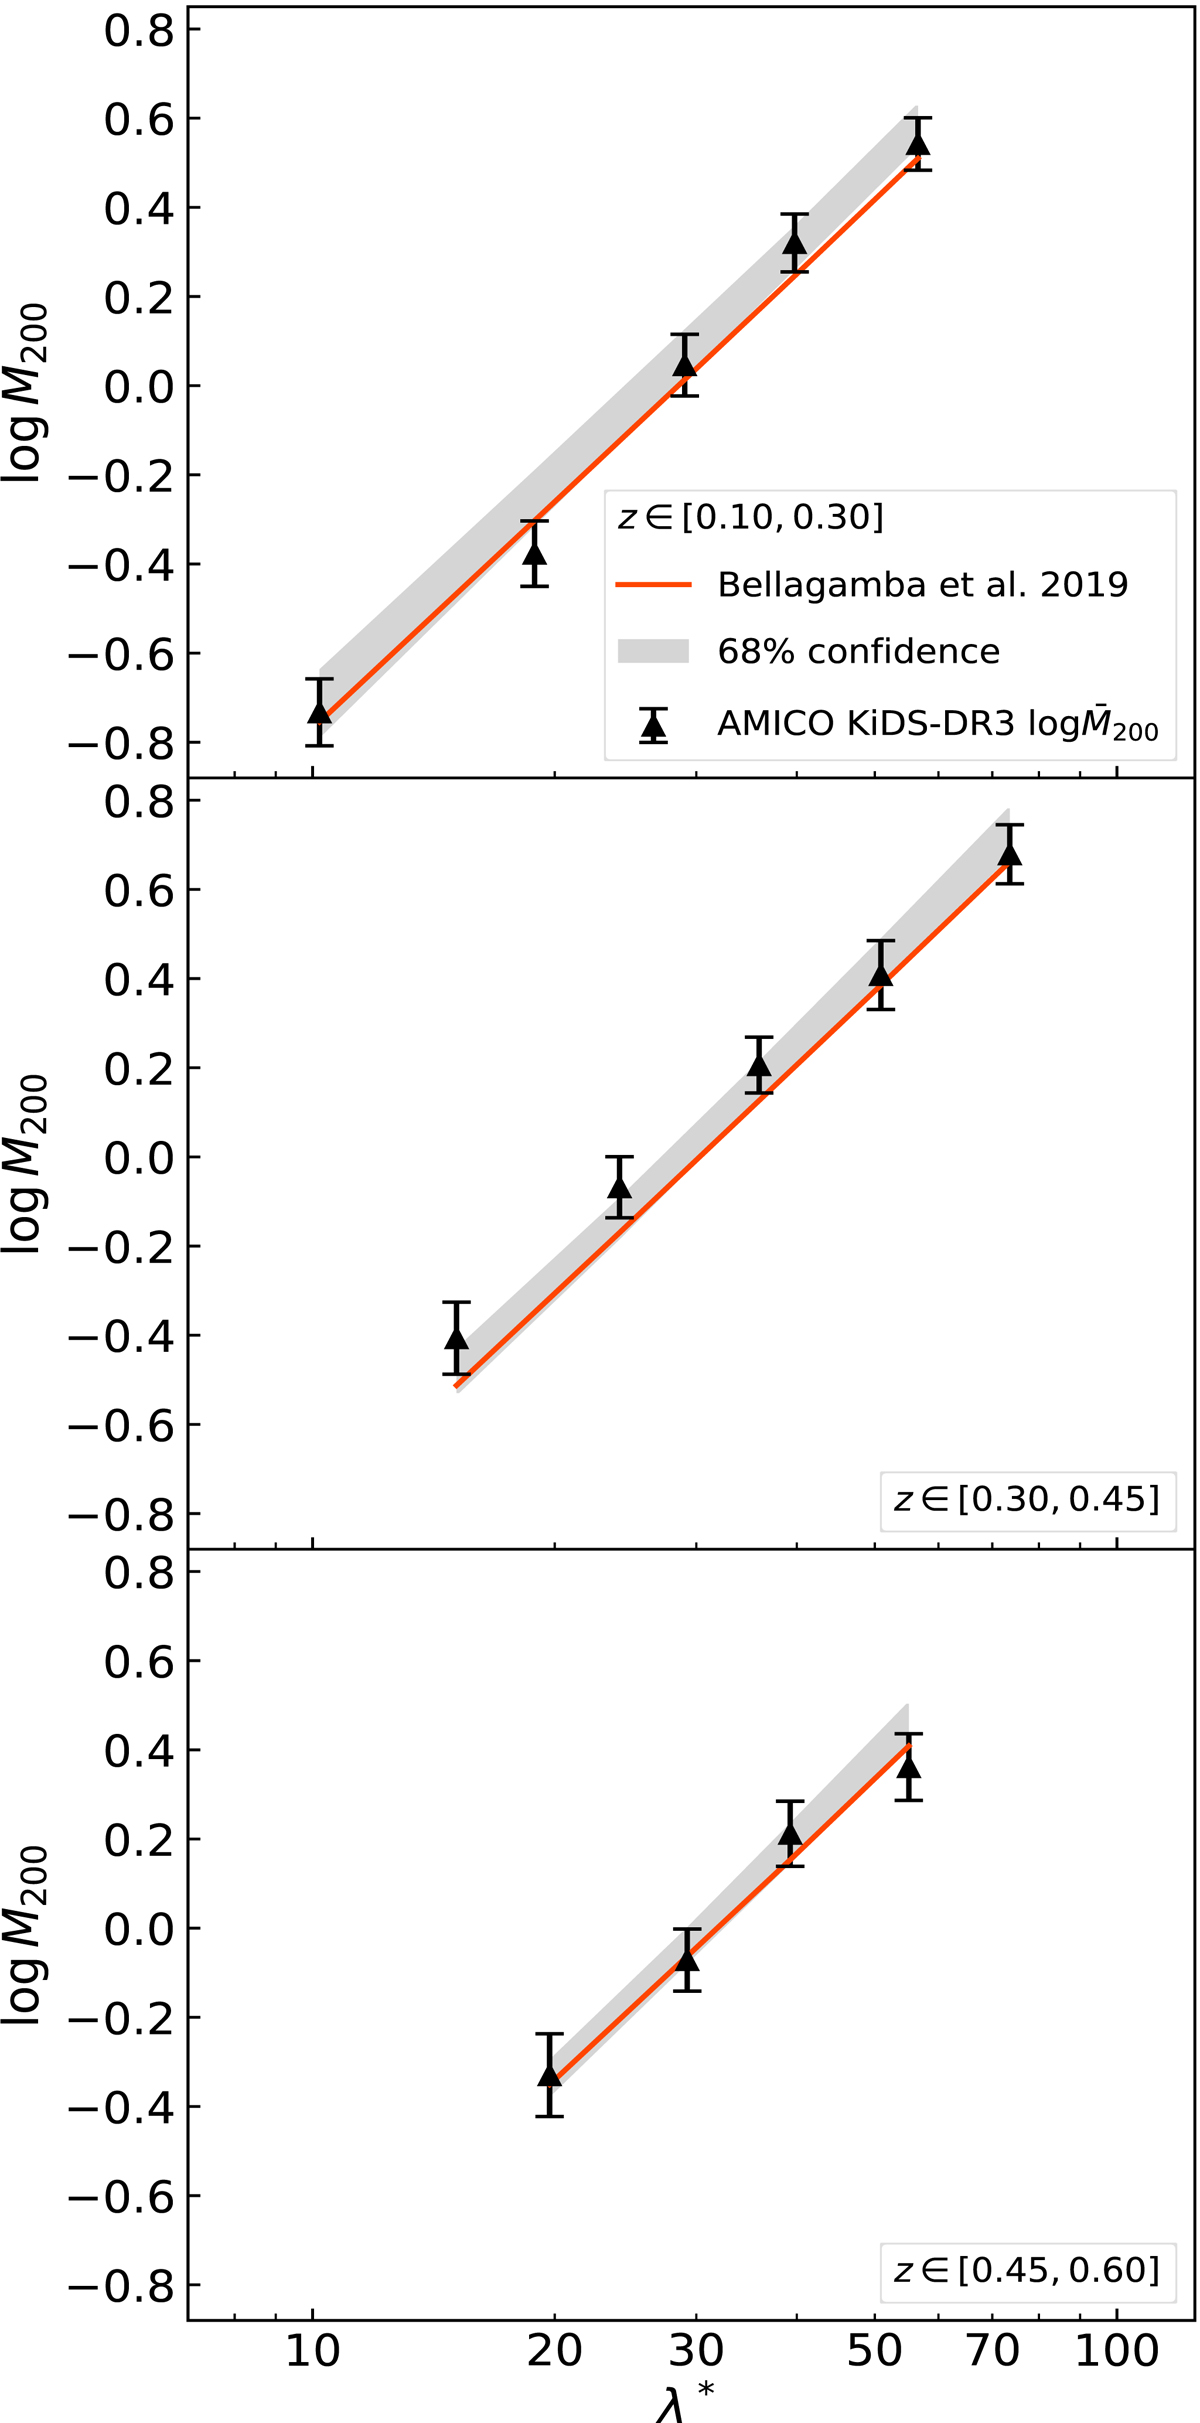
Logarithm of the masses in units of (1014 M⊙ h−1), ![]() , from the AMICO KiDS-DR3 cluster catalogue as a function of the intrinsic richness λ*, in the redshift bins z ∈ [0.10, 0.30], z ∈ [0.30, 0.45], and z ∈ [0.45, 0.60], from top to bottom. The black triangles represent the mean values of
, from the AMICO KiDS-DR3 cluster catalogue as a function of the intrinsic richness λ*, in the redshift bins z ∈ [0.10, 0.30], z ∈ [0.30, 0.45], and z ∈ [0.45, 0.60], from top to bottom. The black triangles represent the mean values of ![]() , given by the mean of the marginalised posterior obtained in the weak lensing analysis, while the error bars are given by 1σ of the posterior distribution. The orange lines represent the median scaling relation obtained by modelling only
, given by the mean of the marginalised posterior obtained in the weak lensing analysis, while the error bars are given by 1σ of the posterior distribution. The orange lines represent the median scaling relation obtained by modelling only ![]() , following the procedure described in Bellagamba et al. (2019). The grey bands represent the 68% confidence level derived from the multivariate posterior of all the free parameters considered in the cosmological analysis described in Sect. 3.
, following the procedure described in Bellagamba et al. (2019). The grey bands represent the 68% confidence level derived from the multivariate posterior of all the free parameters considered in the cosmological analysis described in Sect. 3.
Current usage metrics show cumulative count of Article Views (full-text article views including HTML views, PDF and ePub downloads, according to the available data) and Abstracts Views on Vision4Press platform.
Data correspond to usage on the plateform after 2015. The current usage metrics is available 48-96 hours after online publication and is updated daily on week days.
Initial download of the metrics may take a while.