| Issue |
A&A
Volume 659, March 2022
|
|
|---|---|---|
| Article Number | A32 | |
| Number of page(s) | 19 | |
| Section | Catalogs and data | |
| DOI | https://doi.org/10.1051/0004-6361/202038752 | |
| Published online | 02 March 2022 | |
Turin-SyCAT: A multifrequency catalog of Seyfert galaxies⋆
1
Dipartimento di Fisica, Università degli Studi di Torino, Via Pietro Giuria 1, 10125 Torino, Italy
e-mail: h.pena@eaobservatory.org
2
Instituto Nacional de Astrofísica, Óptica y Electrónica, Apartado Postal 51-216, 72000 Puebla, Mexico
3
East Asian Observatory, 660 North A’ohōkū Place, Hilo, Hawaii 96720, USA
4
Istituto Nazionale di Fisica Nucleare, Sezione di Torino, 10125 Torino, Italy
5
INAF-Osservatorio Astrofisico di Torino, Via Osservatorio 20, 10025 Pino Torinese, Italy
6
Consorzio Interuniversitario per la Fisica Spaziale (CIFS), Via Pietro Giuria 1, 10125 Torino, Italy
7
INAF – Osservatorio di Astrofisica e Scienza dello Spazio, Via Gobetti 93/3, 40129 Bologna, Italy
8
Departamento de Ciencias Físicas, Universidad Andrés Bello, Fernández Concha 700, Las Condes, Santiago, Chile
Received:
25
June
2020
Accepted:
10
September
2021
Aims. We present the first release of Turin-SyCAT, a multifrequency catalog of Seyfert galaxies.
Methods. We selected Seyfert galaxies considering criteria based on radio, infrared, and optical properties and starting from sources belonging to hard X-ray catalogs and surveys. We visually inspected optical spectra available for all selected sources. We adopted homogeneous and stringent criteria in the source selection aiming at reducing the possible contamination from other source classes.
Results. Our final catalog includes 351 Seyfert galaxies distinguished in 233 type 1 and 118 type 2. Type 1 Seyfert galaxies appear to have mid-IR colors similar to blazars, but are distinguished from them by their radio-loudness. Additionally, Seyfert 2 galaxies have mid-IR colors more similar to quasars than BL Lac objects. As expected from their spectral properties, type 1 and 2 Seyfert galaxies show a clear distinction when using the u − r color. Finally, we found a tight correlation between the mid-IR fluxes at both 12 and 22 μm (i.e., F12 and F22, respectively) and hard X-ray fluxes between 15 and 150 keV. Both Seyfert types appear to follow the same trend and share similar values of the ratios of F12 and F22 to FHX in agreement with expectations of the AGN unification scenario.
Conclusions. As future perspectives, the Turin-SyCAT will then be used to search for heavily obscured Seyfert galaxies among unidentified hard X-ray sources, given the correlation between mid-IR and hard X-rays, and to investigate their large-scale environments.
Key words: galaxies: Seyfert / catalogs / galaxies: active
Full Tables A.1–A.5 are only available at the CDS via anonymous ftp to cdsarc.u-strasbg.fr (130.79.128.5) or via http://cdsarc.u-strasbg.fr/viz-bin/cat/J/A+A/659/A32
© ESO 2022
1. A brief historical introduction
The story of Seyfert galaxies began in 1908 when Edward A. Fath discovered peculiar emission lines in the nuclear spectrum of the spiral nebula NGC 1068 (Fath 1909) at the Lick Observatory, later confirmed by Vesto M. Slipher in 1917 (Slipher 1917). At that epoch, the largest fraction of known extragalactic sources showed an optical spectrum dominated by absorption features due to stars, while NGC 1068 presented several relatively bright emission lines.
About two decades later, Hubble (1926), Humason (1932), and Mayall (1934) discovered similar optical emission lines in other nebulae, then identifying them as extragalactic sources. However, we had to wait until 1943 when Carl Keenan Seyfert, reporting on his study of five more galaxies similar to NGC 1068 (namely NGC 1275, 3516, 4051, 4151, and 7469), established the first class of active galactic nuclei (AGNs), showing emission dominated by their nuclear regions. At the end of the 1950s, the “Seyfert galaxies” were mainly characterized by extremely compact nuclei (i.e., < 100 pc) with masses on the order of 108 − 109 M⊙ coupled with emission lines indicating velocities of few thousand kilometers per second in their optical spectra (Burbidge et al. 1959; Woltjer 1959).
In the early 1960s, after the discovery of quasars as cosmological sources (Schmidt 1963), it became clear that Seyfert galaxies shared several properties with them, certainly their cosmological distances (i.e., redshift z), but were less luminous. As more Seyfert galaxies and quasars were discovered, their separation in luminosity narrowed down and almost overlapped (see also Green 1976; Burbidge et al. 1963; Osterbrock & Parker 1965; Pacholczyk & Weymann 1968; Burbidge & Hoyle 1968; Weedman 1976; Schmidt & Green 1983). At that time the community also started noticing that Seyfert galaxies were preferentially hosted in spiral galaxies (Markarian 1967; Sargent 1970; Green 1976; Adams 1977; Heckman 1978; Simkin et al. 1980; Yee 1983; MacKenty 1990; Kotilainen & Ward 1994; Xanthopoulos 1996).
A major step forward for understanding this new class of extragalactic sources was carried out in 1974, when Khachikian and Weedman identified two types of Seyfert galaxies. Optical spectra of Seyfert galaxies are mainly characterized by the presence of permitted emission lines, such as Balmer lines, He IIλ4686 and He Iλ5876, Fe II, and forbidden emission lines: [O II]λ3727, [O III]λλ4959, 5007, [S II]λλ6717, 6731, and [N II]λλ6548, 6584. Balmer lines can have broad (FWHM > 103 km s−1) and narrow components in their profiles. Thus, Seyfert galaxies were classified initially as type 1 or 2 based on the relative width of their Balmer or forbidden emission lines (Khachikian & Weedman 1971, 1974). Type 2 are those with a relative width of Hβ that is similar to that of the [OIII] lines (Weedman 1977; Ho 2008).
Furthermore, Osterbrock (1981) introduced a deeper qualitative classification to account for the range of relative strengths of the Hα and Hβ broad components compared with the narrow lines. Intermediate types of Seyfert galaxies were defined using the broad component of these emission lines, being weaker as indicated by their classification numbers: 1.2, 1.5, 1.8, and 1.9. In the last case the broad component is detectable in Hα but not in Hβ.
Seyfert galaxies can be distinguished from other types of emission-line galaxies, for example starburst and star-forming galaxies or low-ionization nuclear emission-line regions (LINERs) by using diagnostic diagrams based on the line intensity ratios (Veilleux & Osterbrock 1987; Kewley et al. 2006; Stasińska et al. 2006). One of the most used diagnostic tools is the Baldwin-Phillips-Terlevich (BPT) diagram (Baldwin et al. 1981) based on the comparison between the intensity ratios of the [O III] λ5007 to Hβ emission lines and of the [N II] λ6584 to Hα emission lines, where AGNs are well separated from star-forming galaxies (see also Ho et al. 1997; Kewley et al. 2001, 2006; Kauffmann et al. 2003). It is worth noting that in the BPT diagram Seyfert galaxies and LINERs tend to lie in the same region, both having relative intense low-ionization lines (e.g., [OI]λ3727, [OII]λ6300) (Heckman 1980), and thus they could be eventually distinguished according to some empirical criteria, as outlined by Schawinski et al. (2007).
At other wavelengths Seyfert galaxies are commonly known as radio-quiet sources, with radio power typically less than ∼1040 erg s−1 (Ho et al. 1995; Ho & Ulvestad 2001). Radio emission in Seyfert galaxies (see, e.g., Panessa et al. 2019; Chiaraluce et al. 2019, for recent reviews) shows compact morphology and flat spectrum, and extended parsec-scale emission with brightness temperature > 107 K resembling jet emission, as shown by large baseline interferometry (see also Bontempi et al. 2012; Sebastian et al. 2020).
Seyfert galaxy emission at infrared (IR) frequencies accounts for a significant percentage of their bolometric luminosity. Their IR light consists of several components, including continuum emission dominated by the re-processed radiation arising from the dusty torus, heated by the central AGN (Efstathiou & Rowan-Robinson 1995; Tristram et al. 2007; Nenkova et al. 2008; Mor et al. 2009; Alonso-Herrero et al. 2011; Siebenmorgen et al. 2015; González-Martín et al. 2019). In addition, their IR emission also show (i) a contribution due to star formation (Cid Fernandes et al. 2001; Davies et al. 2007; LaMassa et al. 2012; Diamond-Stanic & Rieke 2012; García-Bernete et al. 2016; Ruschel-Dutra et al. 2017; Esparza-Arredondo et al. 2018); (ii) polycyclic aromatic hydrocarbons, again related with star formation (Peeters et al. 2004; Sani et al. 2010; Gallimore et al. 2010; Calzetti 2011; Jensen et al. 2017); (iii) emission lines from fine structure ionic species (e.g., [Ne II] 12.8 μm, [Ne III] 15.5 μm, [Ne V] 14.5 μm, [S IV] 10.5 μm) (Ruschel-Dutra et al. 2014), and silicate emissions or other molecular emission (Sturm et al. 2005; Hao et al. 2007; Roche et al. 2007; Mason et al. 2009; Gallimore et al. 2010; Xie et al. 2017; Menezes et al. 2018), often associated with outflows (see, e.g., García-Burillo et al. 2014; Morganti et al. 2015; Alonso-Herrero et al. 2019; Feruglio et al. 2020).
At high energies Seyfert galaxies are also detected in the X-ray band with luminosities L2 − 10 keV ∼ 1038 − 43 erg s−1 (see, e.g., Panessa et al. 2006, for recent work on XMM-Newton and Chandra satellites, and references therein). Their soft X-ray spectra are dominated by a power-law continuum, coupled with a high-energy cutoff, both due to inverse Compton of low-energy photons, from the accretion disk, on relativistic electrons of a hot corona (see, e.g., Mushotzky et al. 1980; Haardt & Maraschi 1991; Singh et al. 2011; Bianchi et al. 2009a). In addition to this X-ray continuum, below a few keV there is a featureless soft excess mainly due to unresolved X-ray emission lines (Fabian et al. 1986; Walter & Fink 1993; Mehdipour et al. 2011; Gliozzi & Williams 2020; Massaro et al. 2006; Bianchi et al. 2006, 2009b), while above ∼6 keV the presence of the Fe Kα fluorescent emission line is often evident, mainly arising from the reflection of the coronal X-ray emission on the accretion disk and the dusty torus (George & Fabian 1991; Nandra & Pounds 1994; Matt et al. 1996; Bianchi et al. 2004; Markowitz et al. 2008; Patrick et al. 2012; Mantovani et al. 2016).
In X-rays, type 1 and 2 Seyfert galaxies are often distinguished on the basis of their intrinsic absorbing column density, with type 2 having NH, int > 1022 cm−2. However, there are heavily absorbed Seyfert 1 galaxies mismatching their optical classifications (Panessa & Bassani 2002; Tueller et al. 2008; Beckmann et al. 2009; Corral et al. 2011; Merloni et al. 2014; Ordovás-Pascual et al. 2017). Considering Seyfert 1.8–1.9 to be optically unobscured, Burtscher et al. (2016) suggest that NH, int > 1022.3 cm−2 matches the X-ray versus optical classification. Moreover, local Seyfert 2 galaxies, selected by [O III] flux, show intrinsic column densities NH > 1024 cm−2 (Maiolino et al. 1998; Risaliti et al. 1999; Ricci et al. 2015), thus are classified as Compton-thick (Matt 1997). In the literature there are reported cases of Compton-thick Seyfert galaxies that changed to Compton-thin according to their X-ray spectral evolution (see, e.g., Matt et al. 2003). Then, at higher energies Seyfert galaxies in the local Universe are also detected in γ rays, possibly coupled with the starburst activity (Hayashida et al. 2013; Ackermann et al. 2012; Wojaczyński et al. 2015).
At zero order, according to the unification model of AGNs (Antonucci 1993), Seyfert galaxies of type 1 and 2 are intrinsically the same but viewed at different angles with respect to the line of sight. In particular, Seyfert 2 galaxies are those observed at larger viewing angles, thus having the central engine obscured by the presence of a dusty torus (see also Pogge 1988). Evidence regarding the role of orientation was found early on by Keel (1980), showing that Seyfert 2 galaxies have random orientation, while Seyfert 1 galaxies are predominantly orientated face-on. This was later confirmed when Antonucci & Miller (1985) found a hidden Seyfert 1-like spectrum in the polarized light of classical Seyfert 2 NGC 1068.
However, today the whole picture appears more complicated since several discoveries are challenging the unification scenario. Observational evidence provided by (i) changing look Seyfert galaxies (e.g., Collin-Souffrin et al. 1973; Aretxaga et al. 1999; LaMassa et al. 2015; Denney et al. 2014; Shappee et al. 2014; Raimundo et al. 2019), (ii) Seyfert 2 galaxies without absorption in X-rays (Pappa et al. 2001), (iii) rare Seyfert galaxies lacking the broad-line region (Panessa & Bassani 2002; Shi et al. 2010), and (iv) the role of the environment triggering the AGN activity (see, e.g., De Robertis et al. 1998; Koulouridis et al. 2006; Villarroel & Korn 2014) are not perfectly in agreement with the previous statements. Then additional analyses of the large-scale environments of Seyfert galaxies discovered a significant excess in the number of companions compared with non-active galaxies (Petrosian 1982; Dahari 1984; MacKenty 1989; Laurikainen & Salo 1995; Rafanelli et al. 1995; Salvato & Rafanelli 1997), and other investigations also found a difference between the ambient richness of the Seyfert 1 and 2 classes, the latter found in environments with higher galaxy density (Dultzin-Hacyan et al. 1999; Koulouridis et al. 2006; Jiang et al. 2016; Villarroel & Korn 2014; Gordon et al. 2017).
In the literature several catalogs or samples of Seyfert galaxies already exist. One of the most statistically robust samples, selected on the basis of homogeneous criteria, is certainly the one based on the Palomar spectroscopic survey of nearby galaxies (Ho et al. 1997, 2003), but unfortunately it lists only 52 Seyfert galaxies. Other Seyfert galaxy catalogs or samples present in the literature are those of Lipovetsky et al. (1987) and Lipovetsky et al. (1988), composed of 959 sources, most of the Seyfert galaxies known at that time, selected via the UV excess method drawn by the First Byurakan Survey (Markarian et al. 1989); the 49 Seyfert galaxies selected from the Harvard Center for Astrophysics (CfA) spectroscopic survey (Huchra & Burg 1992); 80 type 1 and 141 type 2 Seyfert galaxies with observed spectra selected using far-IR colors (de Grijp et al. 1992); 91 Seyfert galaxies listed in the Maiolino & Rieke (1995) sample based on the Revised Shapley-Ames catalog (Sandage & Tammann 1987); 539 Seyfert galaxies present in the BASS survey (Koss et al. 2017); more than 16000 Seyfert galaxies listed in the catalog of quasars and active nuclei of Veron-Cetty & Veron (1989), and Véron-Cetty & Véron (2006, 2010) compiled including those AGN lists collected from an extensive literature search based on such surveys as 2dF/2QZ (Croom et al. 2004), SDSS DR-3 (Fukugita et al. 1996; Abazajian et al. 2005), as well as compact radio sources in the ICRF2 (Fey et al. 2015), VLBA (Beasley et al. 2002; Fomalont et al. 2003), the large quasar astrometric catalog (Souchay et al. 2009), and X-ray discovered AGNs (Treister et al. 2005). However, all these catalogs or samples are characterized either by having a relatively small number of sources (i.e., fewer than 100 objects) or being highly contaminated by different AGN classes, such as radio galaxies or quasars. In many cases sources listed in these samples lack optical spectroscopic redshifts, and Seyfert classification is not based on multifrequency criteria.
Here we present the first release of the Turin-SyCAT, a multifrequency selected catalog of Seyfert galaxies. Datasets, observations, and information regarding all sources listed therein are mainly gathered from radio, optical, infrared, and X-ray surveys and will permit searches for trends or correlations between different observed quantities (see, e.g., Stern et al. 2012; Gandhi et al. 2009; Ichikawa et al. 2019) and, as a future perspective, studies of the large-scale environment of Seyfert galaxies (see, e.g., Koulouridis et al. 2006; Jiang et al. 2016).
It is important to note that to build the Turin-SyCAT we adopted homogeneous and stringent selection criteria based on multifrequency observations, thus focusing on a source selection that minimizes the possible contamination of other source classes. We anticipate that this choice prevents us from claiming that the catalog is complete at any level.
An example of a catalog that inspired our choice is the Roma-BZCAT (Massaro et al. 2009, 2015a), which lists extragalactic sources known as blazars. The Roma-BZCAT was compiled using different surveys, catalogs, and lists of sources classified as blazars found in the literature. The Roma-BZCAT is undoubtedly incomplete and includes many different biases due to the selection criteria of the catalogs used to create it. However, the underlying, precise inspection of multifrequency observations available for all sources listed there combined with stringent classification criteria lead to an extremely low contamination from sources belonging to other classes.
Thanks to the homogenous and stringent criteria adopted for source selection of the Roma-BZCAT it was possible to discover the WISE γ-rays strip (Massaro et al. 2011), leading to new methods for searching for potential counterparts of Fermi-LAT unidentified or unassociated sources (e.g., Abdollahi et al. 2020); to study the luminosity function of blazars (e.g., Ajello et al. 2014); to select potential targets for the Cherenkov Telescope Array (CTA) (Arsioli et al. 2015); to search for counterparts of new flaring γ-ray sources (e.g., Bernieri et al. 2013); and to obtain limits on the dark matter annihilation in sub-halos (e.g., Zechlin & Horns 2012; Berlin & Hooper 2014). Thus, motivated by the experience collected thanks to the use of the Roma-BZCAT, we decided to build the Turin-SyCAT favoring a source selection with low contamination from other classes rather than its completeness.
This paper is organized as follows. In Sect. 2 we list all the catalogs and surveys used to carry out our initial Seyfert galaxy selection. Section 3 is devoted to the outline of all selection criteria and thresholds adopted. Section 4 is dedicated to the catalog description and cross-matches with multifrequency databases. Results of the characterization of the Seyfert galaxy population achieved thanks to this first release of the Turin-SyCAT is presented in Sect. 5. Section 6 presents our summary, conclusions, and future perspectives. All tables can be found in Appendix A. Finally, Appendix B is dedicated to checking redshift dependences in the WISE color-color space.
We use cgs units unless stated otherwise. WISE magnitudes are in the Vega system and are not corrected for the Galactic extinction. As shown in our previous analyses (D’Abrusco et al. 2014; D’Abrusco et al. 2019; Massaro & D’Abrusco 2016), this correction affects mainly the magnitude at 3.4 μm for sources lying at low Galactic latitudes (i.e., |b|< 20°), and it ranges between 2% and 5% of their magnitude values, thus do not significantly affect our results. We indicate the WISE magnitudes at 3.4, 4.6, 12, and 22 μm as W1, W2, W3, and W4, respectively. For all WISE magnitudes of sources flagged as extended in the AllWISE catalog (i.e., extended flag “ext_flg” greater than 0) we used values measured in the elliptical aperture1. Sloan Digital Sky Survey (SDSS) and Panoramic Survey Telescope & Rapid Response System (Pan-STARRS) magnitudes are in the AB system. We adopted ΛCDM cosmology with Ωm = 0.286, and Hubble constant H0 = 69.6 km s−1Mpc−1 (Bennett et al. 2014) to compute cosmological corrections. Finally, given the large number of acronyms used here, mostly due to the different classifications and telescopes used, we summarize them in Table 1.
Acronyms used in the text.
2. Surveys and catalogs
We selected Seyfert galaxies for this first release of the Turin-SyCAT from the following two main hard X-ray surveys.
-
The third release of the Palermo BAT source catalog (hereafter 3PBC)2, including all hard X-ray sources detected by the BAT instrument on board the Neil Gehrels Swift Observatory within the first 66 months of mission (see, e.g., Segreto et al. 2010; Cusumano et al. 2010). The 3PBC includes 1586 sources, 1387 with an assigned low-energy counterpart, all detected above a level of confidence of 4.8σ Gaussian equivalent. The survey has a flux limit of 9.2 × 10⁻¹² erg s−1 cm−2 at Galactic latitudes |b|> 10°. For the construction of 3PBC Cusumano et al. (2010) used a dedicated procedure presented with details in Segreto et al. (2010). This procedure optimizes the signal-to-noise ratio in energy and time; it performs screening, mosaicking, and source detection on masked data in several energy bands, namely 15–30 keV, 15–70 keV and 15–150 keV. Then 3PBC counterparts were associated by cross-correlating with source databases and analyzing imaging data from soft X-ray datasets, such as those collected from Swift-XRT.
-
The BAT 105-month survey (hereafter BAT105)3 carried out again using the data collected by the BAT instrument, but reduced with a different procedure with respect to that of the 3PBC and by a different group (Oh et al. 2018). The BAT105 hard X-ray catalog is based on a 105-month Swift-BAT all-sky hard X-ray survey listing 1632 sources, of which 129 unidentified sources in 14–195 keV energy band again above 4.8σ Gaussian equivalent detection significance. The survey has a flux limit of 8.4 × 10⁻¹² erg s−1 cm−2 over 90% of the sky. To build the BAT105, Oh et al. (2018) extracted data from single snapshot images in the energy bands 14–20 keV, 20–24 keV, 24–35 keV, 35–50 keV, 50–75 keV, 75–100 keV, 100–150 keV, and 150–195 keV, and then built all-sky mosaics and band-integrated images. BAT105 counterparts were associated by cross-matching their positions within 15′ of the soft X-ray sources listed in several catalogs.
We augmented both hard X-ray surveys (i.e., 3PBC and BAT105) by including hard X-ray unidentified sources classified as Seyfert galaxies during the optical spectroscopic campaign targeting low-energy counterparts of both Swift-BAT and INTEGRAL unidentified sources (see, e.g., Masetti et al. 2004, 2006, 2010, 2012, 2013). Thanks to this campaign, we were able to find 44 additional Seyfert galaxies. This sample is less homogeneous than the previous ones, but follow-up spectroscopic observations complement the selection based on the 3PBC and the BAT105, thus motivating our choice of including them.
It is worth noting that 90% and 95 % of the 3PBC sources have been classified and spectroscopically identified above 4.9 and 13 × 10−11 erg s−1 cm−2 flux levels, respectively. In Fig. 1 we report the fraction of unidentified hard X-ray sources over the total number of 3PBC sources above a certain hard X-ray flux threshold. The entire 3PBC appears to be classified at the level of ∼85%, even if not all sources are spectroscopically identified and no multifrequency criteria were adopted.
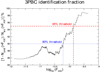 |
Fig. 1. Identification fraction of sources listed in the 3PBC computed as the ratio of the number of unidentified sources (Nunid) to the total number of sources (Nsrc) with flux in the hard X-ray band 15–150 keV, above a certain threshold. The blue and red lines indicate the hard X-ray flux for which the 3PBC has 90 and 95% identification, respectively. About 85% of the sources in the 3PBC appear to have an optical spectroscopic classification. |
3. Selection criteria
Given our primary goal of creating a catalog of Seyfert galaxies, with homogeneous selection criteria based on multifrequency observations, to investigate their properties having a negligible fraction of contaminants, we adopted the following minimum requirements for a source to be included in the Turin-SyCAT.
3.1. Step-by-step procedure
We inspected all sources belonging to surveys and catalogs previously listed (see Sect. 2), and we included only those selected according to the following criteria. Each step of the selection process is also summarized in the flow chart available in Fig. 2.
-
A published optical spectrum. This is to guarantee its classification, at least distinguishing between type 1 and type 2 Seyfert galaxies, and a definite redshift estimate. The reference for the spectrum inspected to check both redshift and classification is reported in Appendix A.
-
Radio luminosity lower than 1040 erg s−1 whenever there is a radio counterpart belonging to one of the major radio surveys, namely NVSS and SUMSS. We adopted this conservative criterion to exclude jetted AGNs (i.e., radio galaxies and blazars Capetti et al. 2017a,b; Heckman & Best 2014).
-
A mid-IR counterpart listed in the AllWISE Source catalog. This allows us to have a uniform set of coordinates, flux, and magnitude measurements.
-
A L3.4 μm < 3 × 10¹¹ L⊙, as an arbitrary limit to differentiate Seyfert galaxies from quasars. This threshold is of the same order of magnitude as used in optical bands (Boroson & Green 1992). Below this threshold there is an overlap in the luminosity distribution between quasars and Seyfert galaxies, although the former can reach luminosities above 1011 L⊙; thus, cutting our sample just using the infrared L3.4 μm value guarantees avoiding bright quasars as contaminants of our selection4. We performed K-correction to the luminosity by assuming a spectral shape of a power law with spectral index calculated using magnitudes in the W1 and W2 WISE bands5.
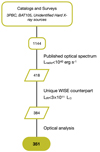 |
Fig. 2. Flow chart highlighting all steps and thresholds applied to select the final sample of Seyfert galaxies belonging to the first release of the Turin-SyCAT. We selected sources with radio luminosity lower than 1040 erg s−1 to avoid jetted AGNs and L3.4 μm < 1011 L⊙ to avoid quasars. |
The angular separation adopted to search for a radio counterpart in the major surveys are 11″ and 8″ for the NVSS and SUMSS, respectively. Previous analyses indicate that the probability of spurious associations at these angular separations is almost negligible (see, e.g., D’Abrusco et al. 2012; D’Abrusco et al. 2019). The lack of a radio counterpart in one of these surveys automatically implies that the source has a radio luminosity below our threshold of 1040 erg s−1 at redshifts lower than ∼0.4, the same redshift range as the Turin-SyCAT.
Then, we cross-matched between WISE coordinates and the position in the original catalog or survey. We chose an angular separation of  , statistically derived and successfully adopted in our previous analyses (Massaro et al. 2012a, 2015b; D’Abrusco et al. 2013); this corresponds to a chance of spurious associations lower than 1% (Massaro et al. 2011, 2013a). These cross-matches allowed us to assign all Seyfert galaxies the coordinates of their mid-IR counterparts so that their positions can be uniformly estimated. Hereafter we use WISE coordinates for all other cross-matches.
All numbers related to the initial sample of Seyfert galaxies extracted from each starting survey or catalog are summarized in Table 2 and are described as follows. Here we report the total number of sources in each catalog together with those classified as Seyfert galaxies, those selected as investigated, and the final number of sources identified and listed in the Turin-SyCAT.
-
The 3PBC catalog lists a total of 1593 hard X-ray sources with 534 unidentified sources, 356 of which are associated with a low-energy counterpart classified as Seyfert 1 and 164 as Seyfert 2. When inspecting this catalog we only extracted a total of 265 Seyfert galaxies that met our criteria. An additional 35 sources were also identified thanks to the optical spectroscopic observations carried out for the unidentified hard X-ray sources (see, e.g., Masetti et al. 2013, and references therein).
-
The BAT105 catalog lists 827 sources classified as Seyfert galaxies. Here we selected a total of 289 Seyfert galaxies plus an additional 42 classified as Seyfert galaxies from those observed during the optical spectroscopic campaign of unidentified hard X-ray sources. In particular, 280 Seyfert galaxies belong to both the 3PBC and the BAT105 catalog.
Number of sources in the starting catalogs or samples for the initial Seyfert galaxy selection.
The total number of Seyfert galaxies selected from the previous surveys and catalog was 351.
We note that for each sample listed above the number of selected Seyfert galaxies is significantly lower than the original one. The main reasons underlying this discrepancy are mainly due to the fact that we classify as Seyfert galaxies only those sources with radio power lower than 1040 erg s−1 and that we found a significant number of sources lacking an optical spectrum such that we could not verify the z estimate and its proper classification.
We note that the Seyfert classification adopted, for example, in the Swift-BAT catalogs 3PBC and BAT105, is often misleading since it is based only on the optical properties of the hard X-ray counterparts; there are many radio galaxies belonging to the Third Cambridge Catalog (3C; Edge et al. 1959) or the Fourth Cambridge catalog (4C; Gower et al. 1967; Pilkington & Scott 1965) erroneously classified as Seyfert galaxies but whose whole multifrequency behavior is certainly more similar to radio galaxies. We reclassified the sources classified as quasars according to our multifrequency criteria. The proportion of quasars found in the input catalogs was less than 1%, given the luminosity cut adopted at 3.4 microns. Based on the multifrequency information we discarded those radio galaxies and quasars.
3.2. Optical spectroscopic classification
Our optical spectroscopic classification, type 1 or 2, is based on the criteria outlined by Khachikian & Weedman (1974). In Fig. 3 we show two typical examples to highlight the main optical emission lines present. For the Turin-SyCAT we selected only those sources for which at least three co-authors agree on the same Seyfert galaxy classification inspecting their optical spectra.
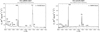 |
Fig. 3. Example of optical spectra of type 1 and type 2 Seyfert galaxies. Left panel: optical spectrum of a classical type 1 Seyfert galaxy: SY1 J0935+2617 (also known as SDSS J093527.09+261709.6) listed in the Turin-SyCAT where broad emission lines are clearly seen in the range 4000 − 9000 Å as indicated. Right panel: same as left panel, but for a typical type 2 Seyfert galaxy: SY2 J1135+5657 (SDSS J113549.08+565708.2), lacking broad emission lines. The main spectral emission and/or absorption features are labeled in both figures, thus providing clear examples of those spectra searched for in the literature to prepare the Turin-SyCAT. |
Both classes of Seyfert galaxies show the presence of narrow emission lines (widths of ∼102 km s−1) in their optical spectra interpreted as being due to low-density (ne ∼ 103 − 106 cm−3) gas clouds photoionized by the central source (Koski 1978; Ferland & Netzer 1983; Stasińska 1984). Broad emission lines (widths up to 104 km s−1), due to permitted transition, are visible only in type 1 Seyfert galaxies where the absence of broad forbidden emission lines indicates relatively high-density (i.e., ne > 109 cm−3) gas clouds.
In addition weak absorption features due to late-type giant stars in the host galaxy are also observed in both type 1 and type 2 Seyfert spectra; absorption lines are relatively weak because the starlight is diluted by the non-stellar featureless continuum. The AGN continuum is usually so weak in Seyfert 2 galaxies that it is quite difficult to isolate it from the stellar continuum unambiguously (Storchi-Bergmann et al. 1998; Contini & Viegas 2000).
The final number of Seyfert galaxies listed in this first release of the Turin-SyCAT is 351: 233 type 1 and 118 type 2. In the current release, we only distinguished between type 1 and type 2 Seyfert galaxies. Intermediate types (i.e., as subclasses of Seyfert 1.2, 1.5, 1.8, and 1.9 ) for which there is a detection of a broad component were all classified as type 1. We do not provide the intermediate classification in the current release since we do not have homogeneous spectral data for all to refine our classification. However, we will present a refinement of the spectral classification at least for those Seyfert galaxies lying in the SDSS footprint in future releases of the Turin-SyCAT.
It is also worth noting that narrow-line spectra are clearly distinguishable from the HII-region spectra seen in normal galaxies. Seyfert galaxies show a wide range in ionization level, which is typical of a gas ionized by a source where the input continuum spectrum falls off slowly (relative to a Wien law) at ionizing wavelengths. On the other hand, on the basis of the data collected to date, it was not possible to distinguish Seyfert galaxies from low-luminosity active galaxies classified as LINERs (Baldwin et al. 1981; Kauffmann et al. 2003; Kewley et al. 2006).
4. The Turin-SyCAT
We labeled all sources listed in the first release of the Turin-SyCAT with a prefix Sy1 or Sy2 following by coordinates in the format J0000+0000 to have a unique identifying name. For only 10 sources out of 351, our optical classification was different from the one reported in the literature; in any case, both classifications are reported in the final catalog table available in Appendix A. We also note that narrow-line Seyfert 1 galaxies (Osterbrock & Pogge 1985) are labeled in our catalog as Sy1.
In Fig. 4 the lack of type 2 Seyfert galaxies above z = 0.1 is quite evident, and that at z > 0.04 the fraction of type 2 to type 1 Seyfert drastically drops, suggesting that the samples and catalogs used to create the Turin-SyCAT could be incomplete.
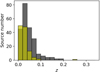 |
Fig. 4. Redshift distribution of all Seyfert galaxies included in the first release of the Turin-SyCAT. Seyfert galaxies classified as type 1 are shown in black, while those classified as type 2 are in yellow. (This color scheme is adopted through the entire manuscript). It is worth noting that type 2 Seyferts are basically not selected at z > 0.1. |
The sky distribution, computed using the Aitoff projection, of all 351 Turin-SyCAT sources is then reported in Fig. 5 where a larger fraction of sources (203) have declinations δ > 0°, where it is to easier to get access to optical telescopes to perform source identifications (Green et al. 1986; Colless et al. 2001; Jones et al. 2004; Aguado et al. 2019).
 |
Fig. 5. Sky distribution of all 351 Seyfert galaxies listed in the Turin-SyCAT, in the Aitoff projection. Seyfert 1 are represented as black stars and Seyfert 2 as yellow circles. |
All Seyfert galaxies are detected in all four WISE bands. In the near-IR (i.e., 2MASS, automatically associated in the AllWISE catalog), we have 350 sources detected in J band and H band, and 347 in Ks band out of a total of 351, with only 1 source (SY2 J0952−6232) lacking a 2MASS counterpart.
The number of Seyfert galaxies within the SDSS footprint is 193 out of 351; all of them having a unique cross-match within 1″. Three associations at larger angular separations are SY2 J1001+5540, SY1 J1136+2135, and SY2 J1225+1239, having the SDSS counterpart at  ,
,  , and
, and  from their WISE positions, respectively. In the SDSS footprint are 78 out of 193 Seyfert galaxies with redshift estimates. For all of them we compared SDSS redshift values with those obtained in the literature and inspected by us during the selection process. The redshift differences between those reported in the SDSS and those we collected are all less than 10−3.
Once we obtain uniform coordinates for all sources in Turin-SyCAT, thanks to their WISE counterparts, we cross-matched our catalog with the Fourth IBIS/ISGRI Soft Gamma-Ray Survey Catalog6 (IBISCAT4; Bird et al. 2007), and with the ROSAT Bright and Faint Source catalogs (RBSC and FRSC, respectively; Voges et al. 1999, 2000). To carry out all these cross-matches, we adopted a conservative positional uncertainty for WISE coordinates of 1″, much larger than that reported in the AllWISE catalog (Wright et al. 2010), but our results are not affected significantly by this choice. All matches are also unique, as expected by the low sky density of the hard X-ray sources.
In the hard X-ray sky, we found that 102 out of 351 Seyfert galaxies lie within the positional uncertainty of IBISCAT4 sources; this result was found using the positional uncertainty reported in the IBISCAT4. Finally, from the cross-match with the RBSC and the FRSC catalogs (Voges et al. 1999, 2000) finding that 160 Seyfert galaxies out of 351 have a soft X-ray counterpart, a unique match, within the positional uncertainty reported for the X-ray coordinates and 1″ for AllWISE coordinates, as previously considered.
Finally, Fig. 6 shows the Venn diagram of the Seyfert galaxies selected for the first release of the Turin-SyCAT having a hard X-ray counterpart in the 3PBC and/or in the BAT105 catalogs or discovered thanks to the optical spectroscopic campaign of unidentified hard X-ray sources.
 |
Fig. 6. Venn diagram of sources selected for Turin-SyCAT and associated in both the 3PBC and the BAT105, highlighting those discovered thanks to the optical spectroscopic campaign of unidentified hard X-ray sources, is shown. |
5. Characterizing the Seyfert galaxy population
5.1. Infrared emission
We compared the mid-IR colors of type 1 and type 2 Seyfert galaxies listed in this first release of the Turin-SyCAT (see Fig. 7) since all selected sources have a WISE counterpart detected in all four WISE bands with only one exception (see Sect. 3 for additional details).
 |
Fig. 7. Color-color diagrams based on the WISE magnitudes comparing Seyfert galaxies of type 1 (black) and type 2 (yellow) with generic mid-IR sources selected in a random region of the sky (see Massaro et al. 2011, 2013a,b, 2016, for a similar analysis). Seyfert galaxies of type 2 appear to be redder than those of type 1, and are quite separated in the W1–W2 vs. W2–W3 color-color plot in the left lower. |
The distribution of the W1–W2 color appears to be more concentrated for the Seyfert galaxies of type 1, while that of type 2 covers a broader range. No clear differences are visible in both WISE color diagrams, with the only exception that overall Seyfert 2 galaxies tend to be redder than Seyfert 1. More than 90% of type 1 galaxies and ∼50% of type 2 have the mid-IR color W1 − W2 > 0.5, the same criterion used to identify and select AGNs from other sources (Ashby et al. 2009), while adopting a more conservative threshold (low contamination from other source classes) ∼75% of Seyfert 1 galaxies and ∼40% of Seyfert 2 show W1 − W2 > 0.8 (Stern et al. 2012).
To test that such differences are not related to the redshift distributions of type 1 and type 2 Seyfert galaxies we also compared their IR colors in a restricted redshift range of 0.01 bin size, and we confirmed the previous results (see Appendix B for more details).
Then, given the recent and extensive use of these mid-IR color-color diagrams to select γ-ray blazar-like candidates that could be potential counterparts of unidentified γ-ray sources (Massaro et al. 2012a, 2013a; D’Abrusco et al. 2013; Massaro & D’Abrusco 2016) and targets of optical campaigns (Paggi et al. 2014; Massaro et al. 2014, 2015c; Landoni et al. 2015; Álvarez Crespo et al. 2016; Marchesini et al. 2016, 2019a; Paiano et al. 2017, 2019; Marchesi et al. 2018; Peña-Herazo et al. 2017, 2019), we also compared the mid-IR colors of Seyfert galaxies with those of both BL Lac objects and flat spectrum radio quasars, labeled BZBs and BZQs, respectively, listed in the latest release of Roma-BZCAT (Massaro et al. 2009, 2015a) and associated with a Fermi source in the Fourth Fermi-LAT Source catalog (Abdollahi et al. 2020). This comparison is shown in Fig. 8, where it is clear that in the W1–W2 versus W2–W3 diagrams Seyfert 1 galaxies appear to lie in the middle between BZBs and BZQs, a fraction of them with similar colors, while type 2 Seyfert galaxies have mid-IR colors very distinct from those of blazars. On the other hand, in the W2–W3 versus W3–W4 plane, Seyfert galaxies of type 1 are more similar to BZQs, and the same situation occurs for type 2 Seyfert galaxies. It is worth noting that even if there is a fraction of Seyfert galaxies showing mid-IR colors similar to known γ-ray blazars, as previously noted in de Menezes et al. (2019), these sources do not contaminate the selection of γ-ray blazar candidates significantly since this is also based on the radio-loudness parameter (see D’Abrusco et al. 2014, for more details).
 |
Fig. 8. Comparison between the mid-IR colors of Seyfert galaxies listed in the Turin-SyCAT and the γ-ray blazars of the Roma-BZCAT. Seyfert 1 galaxies tend to be more similar to blazars in their mid-IR emission, in particular when compared with BZQs that have the same infrared and optical properties of normal quasars, while Seyfert 2 galaxies show mid-IR properties similar to BZQs only in the W2–W3 vs. W3–W4 diagram. |
For Turin-SyCAT sources having a counterpart in 2MASS, we also show their near-IR properties in Fig. 9. As in the previous color-color diagrams, Seyfert 2 galaxies are redder than type 1 sources, but even if they are very distinct from background sources, they show quite similar properties.
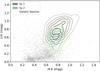 |
Fig. 9. Color-color diagrams based on the 2MASS magnitudes comparing contours of Seyfert galaxies of type 1 (gray-to-black) and type 2 (yellow-to-green) with generic sources selected in a random region of the sky (see Massaro et al. 2011, for a similar analysis). While Seyfert galaxies occupy a distinct region from that of generic infrared sources their near-IR properties are quite similar. Isodensity contours are computed using KDE (see, e.g., D’Abrusco et al. 2019). |
5.2. Optical properties
Given the significant number of Seyfert galaxies lying in the SDSS footprint selected for the first release of the Turin-SyCAT (see Sect. 3), we also compared their optical colors with their mid- and near-IR colors, as shown in Fig. 10.
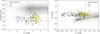 |
Fig. 10. Comparison between the optical and the mid-IR (left panel) and near-IR (right panel) colors for both Seyfert galaxies of type 1 (black in both plots) and type 2 (yellow in both plots). Seyfert galaxies are clearly separated in two distinct regions of both plots when considering the u − r color. These color-color diagrams are drawn only for those Seyfert galaxies lying in the SDSS footprint (see Sect. 3). |
Seyfert galaxies are distinct in their u − r color distribution, as expected given their spectral properties, with Seyfert 1 galaxies being bluer than type 2 sources.
Since all sources listed in the Turin-SyCAT at declinations above −33° also lie in the Pan-STARRS footprint, for a total of 294 counterparts within 1 5, we also inspected this information, but we did not find any additional insight with respect to those already obtainable from SDSS. However, consistently with the mid-IR luminosities, all the R-band optical luminosities computed using the Pan-STARRS measurements lie in the range between 108 and 1011 L⊙ (K corrected). It is worth noting that for all Seyfert galaxies lying both in the Pan-STARRS and SDSS footprints, their R-band magnitudes are consistent within 3σ uncertainty. We also note that for all Seyfert galaxies with a SDSS counterpart the optical luminosity in the R band is lower than 1011 L⊙. Thus, we can confirm that we did not include bright quasars.
5.3. The IR – hard X-ray connection
Restricting the sample to those Seyfert galaxies with a hard X-ray counterpart on the 3PBC, we also performed an analysis comparing mid-IR properties with those in the 15–150 keV energy range. First, we computed the distribution of ratios between their flux at 12 μm and 22 μm (i.e., F12 and F22), and that measured in the hard X-rays (i.e., FHX) between 15 keV and 150 keV, for which we adopted the measurements reported in the 3PBC (see Fig. 11). Our choice of using the 3PBC rather than the BAT105 catalog was motivated by the fact that it has a higher identification fraction given its higher flux limit.
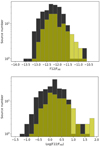 |
Fig. 11. Distributions of the ratios between the integrated flux in the WISE band centered at the nominal wavelength of 12 μm (top panel) and 22 μm (bottom panel), over the integrated flux in the hard X-ray band FHX between 15 and 150 keV collected for all Seyfert galaxies with a counterpart in the 3PBC and selected to belong to the Turin-SyCAT. There is no clear difference between the distributions of type 1 and type 2 Seyfert galaxies appearing in black and yellow, respectively. |
Investigating the connection between the hard X-ray and the mid-IR emission in Seyfert galaxies is crucial since high-energy emission measures an intrinsic radiated luminosity above ∼10 keV, while WISE 12 μm and 22 μm is related to the reprocessed radiation from the dust of all energy absorbed from the optical and UV wavelengths. We did not find any significant difference between the distributions of the infrared-to-hard X-ray flux ratio in Seyfert 1 and Seyfert 2 galaxies according to the Kolmogorov-Smirnov test (p-value = 0.09).
On the other hand, we found two significant trends when comparing the mid-IR fluxes with those in the hard X-ray bands, as shown in Fig. 12. The correlation between F12 and FHX has a linear correlation coefficient of 0.57 (slope of 1.02 ± 0.10) for Seyfert 1 galaxies and 0.52 (slope of 0.93 ± 0.16) for Seyfert 2. In both cases, there is a negligible probability of being spurious.
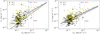 |
Fig. 12. Mid-IR fluxes at 12 μm and 22 μm as a function of hard X-rays flux. Left panel: Correlation found between the W3 integrated flux and that in the hard X-ray band from the 3PBC, for both Seyfert 1 and 2 galaxies (marked in black and yellow, respectively). The dashed black line corresponds to the regression line computed for the whole sample while the straight black and yellow lines mark that for type 1 and type 2 Seyfert galaxies, respectively. The correlation coefficients are reported in Sect. 5.3, while the p-chance values are negligible, all being lower than 10−6. Right panel: same as left plot, but computed using the mid-IR flux at 22 μm. The vertical dashed blue and red lines indicate the flux at which the sample is complete to 90% and 95%, respectively. |
Similar values for the correlation between F22 and FHX being 0.59 (with a slope of 1.05 ± 0.10) for type 1 Seyfert galaxies and 0.49 (slope of 0.95 ± 0.17) for type 2 Seyfert galaxies, with again a probability of less than 10−6. Considering both classes together, given their similar mid-IR to hard X-ray ratios, we found a correlation coefficient of 0.57 and 0.55 (slopes of 0.93 ± 0.08 and 0.95 ± 0.08) for the hard X-ray flux FHX correlating with F12 and F22, respectively. We also show, in blue, the correlation for the 90 % complete subsample with slopes of 0.94 ± 0.41 (linear correlation coefficient of 0.40) and 1.14 ± 0.49 (linear correlation coefficient of 0.41) for F12 and F22, respectively. When considering type 1 and 2 together, the slopes are 1.01 ± 0.09 (linear correlation coefficient of 0.57) and 1.04 ± 0.09 (linear correlation coefficient of 0.55) for F12 and F22, respectively.
Our results are consistent with other literature analyses that found a correlation between the mid-IR and the hard X-ray luminosity in AGNs (Ichikawa et al. 2017, 2019), where the sample was selected from the Swift-BAT 70-month catalog (Baumgartner et al. 2013). Our results are also consistent with those of Gandhi et al. (2009) and Asmus et al. (2015); however, literature analyses are carried out over all AGNs emitting in the hard X-rays here, while for the first time we restricted our analysis only to Seyfert galaxies, and spanning a narrow redshift range but focusing on a precise population.
This correlation was also found for AGNs with luminosities in the hard X-ray band 14–195 keV, L14 − 195 < 1044 erg s−1 with data collected from several X-ray observatories (ASCA, BeppoSAX, Chandra, and XMM-Newton) and compared with Infrared Space Observatory data (samples sizes of 57 and 71, respectively; Lutz et al. 2004; Ramos Almeida et al. 2007) or using Spitzer compared with INTEGRAL (sample size of 68 AGNs, Sazonov et al. 2012).
Carrying out this analysis, we also compared the hard X-ray photon index ΓHX with all mid-IR colors, but we did not find any significant trend and the distribution of ΓHX appear to be the same when comparing type 1 and type 2 Seyfert galaxies.
On the other hand, we also found a correlation between the mid-IR flux computed at 3.4 μm and FHX (correlation coefficient equal to 0.67) as for other mid-IR fluxes, but only a mild trend (correlation coefficient equal to 0.45) is present when comparing near-IR fluxes computed from 2MASS magnitudes and FHX, both with negligible p-chance values. We note that the underlying reason to choose to show only results related to the 3PBC catalog with respect to BAT105 and IBISCAT4 samples is that the former does not have positional uncertainty reported.
As an additional test we also cross-matched our SYCAT sources with the Point Source catalog of the Infrared Astronomical Satellite (IRAS)7 using all the elliptical positional uncertainty regions listed there. We found that 72 Seyfert 1 and 77 Seyfert 2 galaxies have a unique IRAS counterpart at 60 μm and 100 μm. Then we searched for a trend between the flux at 60 μm, and 100 μm (i.e., F60 and F100, respectively) and that measured in hard X-rays from the 3PBC, only for those Seyfert galaxies with a 3PBC counterpart, as previously performed for WISE. As shown in Fig. 13, no clear trend or correlation was found. This is in agreement with our results since cold dust is mostly related to the star formation in SYCAT sources, and it is not expected to be linked directly with the central AGN.
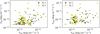 |
Fig. 13. Far-IR fluxes at 60 μm and 100 μm as a function of hard X-rays flux. Left panel: Scatter plot for the integrated flux at 60 μm collected from the IRAS Point source catalog (i.e., F60) and that in the hard X-ray band (i.e., FHX), as listed in the 3PBC, for both Seyfert 1 and 2 galaxies (marked in black and yellow, respectively, as shown in previous figures). No clear trend or correlation is evident. Right panel: same as left plot, but computed using the far-IR flux at 100 μm (i.e., F100). |
6. Summary, conclusions, and future perspectives
The main goal of the study presented here is to create a catalog of Seyfert galaxies with homogeneous and stringent selection criteria based on multifrquency observations. This allows us to check source identification and classification for hard X-ray sources and to search for trends or correlations between different observed quantities.
Our initial selection is based on the two main hard X-ray surveys, namely the third release of the Palermo BAT source catalog (Cusumano et al. 2010) and the BAT 105-month survey (Oh et al. 2018) carried out again using the data collected by the Swift-BAT instrument. Both hard X-ray surveys are also augmented by introducing additional Seyfert galaxies discovered thanks to a follow-up spectroscopic campaign carried out on the unidentified hard X-ray sources, whose aim was to search for low-energy counterparts of unidentified sources (Masetti et al. 2004, 2006, 2009, 2010, 2012, 2013; Parisi et al. 2012; Rojas et al. 2017; Marchesini et al. 2019b).
Applying our selection criteria (see Sect. 4 for details), we built the first release of the Turin-SyCAT, listing 351 Seyfert galaxies: 233 type 1 and 118 type 2. Then, thanks to all cross-matches performed with existing databases, we also carried out a multifrequency analysis of the Seyfert galaxy population. All the sources listed in the Turin-SyCAT have a published spectrum that allowed us to firmly establish their redshifts and their optical spectroscopic classifications, they all have an associated mid-IR counterpart in the AllWISE catalog, and they all have radio luminosity values, when associated with a radio counterpart in one of the major surveys (i.e., NVSS and SUMSS), of less than 1040 erg s−1 and mid-IR luminosity values computed at 3.4 μm lower than 3 × 10¹¹ L⊙. References for their redshifts and for their spectra used to classify the source and for a literature comparison are all reported in Appendix A.
Results of the multifrequency characterization for all Seyfert galaxies listed in the Turin-SyCAT can be summarized as follows:
-
We selected 351 Seyfert galaxies with homogeneous properties at radio, infrared, and optical energies. All Seyfert galaxies are classified as type 1 and type 2, and all their redshifts were verified.
-
Type 1 Seyfert galaxies could have mid-IR colors similar to blazars, but being radio quiet they are barely selected in catalogs of γ-ray blazar candidates. Seyfert 2 galaxies have mid-IR colors more similar to quasars than to BL Lac objects.
-
For those Turin-SyCAT sources with a counterpart in the SDSS footprint, we also highlight that, in agreement with their spectral properties, type 1 and 2 Seyfert galaxies have a neat distinction when using the u − r color.
We also tested that differences in the color-color diagrams are not due to differences in the redshift distribution between type 1 and type 2 Seyfert galaxies.
Comparing the mid-IR properties of those Seyfert galaxies having a 3PBC counterpart only, we found a tight correlation between the mid-IR flux (in the W3 and W4 bands) and that in the 15–150 keV energy range for both classes of Seyfert galaxies. The ratio of these two integrated fluxes is also remarkably similar for both Seyfert types. The correlation is also present when considering the mid-IR flux at 3.4 μm but has less significance when using the near IR fluxes collected thanks to the 2MASS cross-matches. All these correlations are in agreement with expectations of the unification scenario of type 1 and type 2 Seyfert galaxies, where the fraction of luminosity absorbed by dusty components should be the same for both Seyfert types and the differences mainly related to the viewing direction.
In addition, we did not find any trend between far-IR fluxes and hard X-ray ones for all SyCAT sources with a counterpart in the IRAS Point Source Catalog (193 out of 517). In agreement with the fact that relatively cold dust emits at longer wavelengths than those observed by WISE, it is not directly related to the central AGN and the dusty torus obscuring it. We plan to carry out a further investigation of the mid-IR versus hard X-ray connection using the Combined Atlas of Sources with Spitzer IRS Spectra (CASSIS8, Lebouteiller et al. 2011, 2015) since a significant fraction of SyCAT sources (122 out of 351, i.e., ∼35%) have mid-IR spectra already available.
It is worth mentioning that similar tests of the unification scenario were performed in the past by Mulchaey et al. (1994) for a sample of 116 Seyfert galaxies. They found that distributions of [O III] λ5007, infrared, and hard X-ray continuum are similar for Seyfert type 1 and 2. They also discovered a correlation between the ultraviolet continuum and emission-line fluxes in type 1 Seyfert galaxies, but not for type 2, consistent with the idea that the central engine is responsible for powering the line emission, all properties are consistent with those expected in the dusty torus model.
As future perspectives, correlations between the mid-IR and the hard X-ray fluxes could be used to search for heavily obscured Seyfert galaxies, among unidentified hard X-ray sources seen by Swift-BAT and INTEGRAL. Having strong dust absorption, unknown Seyfert galaxies could not emit significantly in the optical energy range, but could show mid-IR to hard X-ray flux ratios similar to those listed in our Turin-SyCAT. We also expect to investigate the large-scale environments of Seyfert galaxies (Dultzin-Hacyan et al. 1999; Koulouridis et al. 2006; Villarroel & Korn 2014; Jiang et al. 2016) using sources listed in Turin-SyCAT adopting the same statistical procedures described in Massaro et al. (2019, 2020) as an additional test for the unification scenario.
Finally, it is worth noting that we are already working on the second release of the Turin-SyCAT, planned for the end of 2021, to increase the number of Seyfert galaxies listed there to 1000 sources. The next release will be carried out including sources from SDSS and ROSAT surveys, thus not based on hard X-ray catalogs.
Acknowledgments
We thank the anonymous referee for useful comments that led to improvements in the paper. H.A.P.H and F.M. are in debt with Prof. D. Weedman for all useful discussions and wish to thank him for all extremely valuable comments and suggestions provided while carrying out this project. This work is supported by the “Departments of Excellence 2018 – 2022” Grant awarded by the Italian Ministry of Education, University and Research (MIUR) (L. 232/2016). H.A.P.-H acknowledges support from CONACyT program for Ph.D. studies. This work was partially supported from CONACyT research grant No. 280789. This investigation is supported by the National Aeronautics and Space Administration (NASA) grants GO9-20083X and GO0-21110X. A.P. acknowledges financial support from the Consorzio Interuniversitario per la fisica Spaziale (CIFS) under the agreement related to the grant MASF_CONTR_FIN_18_02. This research has made use of data obtained from the high-energy Astrophysics Science Archive Research Center (HEASARC) provided by NASA’s Goddard Space Flight Center; the SIMBAD database operated at CDS, Strasbourg, France; the NASA/IPAC Extragalactic Database (NED) operated by the Jet Propulsion Laboratory, California Institute of Technology, under contract with the National Aeronautics and Space Administration. Part of this work is based on the NVSS (NRAO VLA Sky Survey): The National Radio Astronomy Observatory is operated by Associated Universities, Inc., under contract with the National Science Foundation and on the VLA low-frequency Sky Survey (VLSS). The Molonglo Observatory site manager, Duncan Campbell-Wilson, and the staff, Jeff Webb, Michael White and John Barry, are responsible for the smooth operation of Molonglo Observatory Synthesis Telescope (MOST) and the day-to-day observing programme of SUMSS. The SUMSS survey is dedicated to Michael Large whose expertise and vision made the project possible. The MOST is operated by the School of Physics with the support of the Australian Research Council and the Science Foundation for Physics within the University of Sydney. This publication makes use of data products from the Wide-field Infrared Survey Explorer, which is a joint project of the University of California, Los Angeles, and the Jet Propulsion Laboratory/California Institute of Technology, funded by the National Aeronautics and Space Administration. This publication makes use of data products from the Two Micron All Sky Survey, which is a joint project of the University of Massachusetts and the Infrared Processing and Analysis Center/California Institute of Technology, funded by the National Aeronautics and Space Administration and the National Science Foundation. Funding for the SDSS and SDSS-II has been provided by the Alfred P. Sloan Foundation, the Participating Institutions, the National Science Foundation, the US Department of Energy, the National Aeronautics and Space Administration, the Japanese Monbukagakusho, the Max Planck Society, and the Higher Education Funding Council for England. The SDSS Web Site is http://www.sdss.org/. The SDSS is managed by the Astrophysical Research Consortium for the Participating Institutions. The Participating Institutions are the American Museum of Natural History, Astrophysical Institute Potsdam, University of Basel, University of Cambridge, Case Western Reserve University, University of Chicago, Drexel University, Fermilab, the Institute for Advanced Study, the Japan Participation Group, Johns Hopkins University, the Joint Institute for Nuclear Astrophysics, the Kavli Institute for Particle Astrophysics and Cosmology, the Korean Scientist Group, the Chinese Academy of Sciences (LAMOST), Los Alamos National Laboratory, the Max-Planck-Institute for Astronomy (MPIA), the Max-Planck-Institute for Astrophysics (MPA), New Mexico State University, Ohio State University, University of Pittsburgh, University of Portsmouth, Princeton University, the United States Naval Observatory, and the University of Washington. This research has made use of the Palermo BAT catalog and database operated at INAF – IASF Palermo TOPCAT (http://www.star.bris.ac.uk/~mbt/topcat/) (Taylor 2005) for the preparation and manipulation of the tabular data and the images. The Aladin Java applet (http://aladin.u-strasbg.fr/aladin.gml) was used to create the finding charts reported in this paper (Bonnarel et al. 2000). It can be started from the CDS (Strasbourg – France), from the CFA (Harvard – USA), from the ADAC (Tokyo – Japan), from the IUCAA (Pune – India), from the UKADC (Cambridge – UK), or from the CADC (Victoria – Canada).
References
- Abazajian, K., Adelman-McCarthy, J. K., Agüeros, M. A., et al. 2005, AJ, 129, 1755 [NASA ADS] [CrossRef] [Google Scholar]
- Abdollahi, S., Acero, F., Ackermann, M., et al. 2020, ApJS, 247, 33 [Google Scholar]
- Ackermann, M., Ajello, M., Allafort, A., et al. 2012, ApJ, 755, 164 [NASA ADS] [CrossRef] [Google Scholar]
- Adams, T. F. 1977, ApJS, 33, 19 [NASA ADS] [CrossRef] [Google Scholar]
- Aguado, D. S., Ahumada, R., Almeida, A., et al. 2019, ApJS, 240, 23 [Google Scholar]
- Ajello, M., Romani, R. W., Gasparrini, D., et al. 2014, ApJ, 780, 73 [Google Scholar]
- Alonso-Herrero, A., Ramos Almeida, C., Mason, R., et al. 2011, ApJ, 736, 82 [NASA ADS] [CrossRef] [Google Scholar]
- Alonso-Herrero, A., García-Burillo, S., Pereira-Santaella, M., et al. 2019, A&A, 628, A65 [NASA ADS] [CrossRef] [EDP Sciences] [Google Scholar]
- Álvarez Crespo, N., Massaro, F., Milisavljevic, D., et al. 2016, AJ, 151, 95 [CrossRef] [Google Scholar]
- Antonucci, R. 1993, ARA&A, 31, 473 [Google Scholar]
- Antonucci, R. R. J., & Miller, J. S. 1985, ApJ, 297, 621 [NASA ADS] [CrossRef] [Google Scholar]
- Aretxaga, I., Joguet, B., Kunth, D., Melnick, J., & Terlevich, R. J. 1999, ApJ, 519, 123 [Google Scholar]
- Arsioli, B., Fraga, B., Giommi, P., et al. 2015, A&A, 579, A34 [NASA ADS] [CrossRef] [EDP Sciences] [Google Scholar]
- Ashby, M. L. N., Stern, D., Brodwin, M., et al. 2009, ApJ, 701, 428 [Google Scholar]
- Asmus, D., Gandhi, P., Hönig, S. F., et al. 2015, MNRAS, 454, 766 [NASA ADS] [CrossRef] [Google Scholar]
- Baldwin, J. A., Phillips, M. M., & Terlevich, R. 1981, PASP, 93, 5 [Google Scholar]
- Baloković, M., Smolčić, V., Ivezić, Ž., et al. 2012, ApJ, 759, 30 [CrossRef] [Google Scholar]
- Barnothy, J. M., & Barnothy, M. F. 1968, AJ, 73, 912 [NASA ADS] [CrossRef] [Google Scholar]
- Baumgartner, W. H., Tueller, J., Markwardt, C. B., et al. 2013, ApJS, 207, 19 [Google Scholar]
- Berlin, A., & Hooper, D. 2014, Phys. Rev. D, 89, 016014 [NASA ADS] [CrossRef] [Google Scholar]
- Bernieri, E., Campana, R., Massaro, E., et al. 2013, A&A, 551, L5 [NASA ADS] [CrossRef] [EDP Sciences] [Google Scholar]
- Beasley, A. J., Gordon, D., Peck, A. B., et al. 2002, ApJS, 141, 13 [NASA ADS] [CrossRef] [Google Scholar]
- Beckmann, V., Soldi, S., Ricci, C., et al. 2009, A&A, 505, 417 [NASA ADS] [CrossRef] [EDP Sciences] [Google Scholar]
- Bennett, C. L., Larson, D., Weiland, J. L., & Hinshaw, G. 2014, ApJ, 794, 135 [Google Scholar]
- Bianchi, S., Matt, G., Balestra, I., et al. 2004, A&A, 422, 65 [NASA ADS] [CrossRef] [EDP Sciences] [Google Scholar]
- Bianchi, S., Guainazzi, M., & Chiaberge, M. 2006, A&A, 448, 499 [NASA ADS] [CrossRef] [EDP Sciences] [Google Scholar]
- Bianchi, S., Guainazzi, M., Matt, G., et al. 2009a, A&A, 495, 421 [NASA ADS] [CrossRef] [EDP Sciences] [Google Scholar]
- Bianchi, S., Piconcelli, E., Chiaberge, M., et al. 2009b, ApJ, 695, 781 [Google Scholar]
- Bird, A. J., Malizia, A., Bazzano, A., et al. 2007, ApJS, 170, 175 [Google Scholar]
- Bonnarel, F., Fernique, P., Bienaymé, O., et al. 2000, A&AS, 143, 33 [NASA ADS] [CrossRef] [EDP Sciences] [Google Scholar]
- Bontempi, P., Giroletti, M., Panessa, F., et al. 2012, MNRAS, 426, 588 [NASA ADS] [CrossRef] [Google Scholar]
- Boroson, T. A., & Green, R. F. 1992, ApJS, 80, 109 [Google Scholar]
- Burbidge, G. R., & Hoyle, F. 1968, AJ, 73, 907 [NASA ADS] [CrossRef] [Google Scholar]
- Burbidge, E. M., Burbidge, G. R., & Prendergast, K. H. 1959, ApJ, 130, 26 [NASA ADS] [CrossRef] [Google Scholar]
- Burbidge, G. R., Burbidge, E. M., & Sandage, A. R. 1963, Rev. Mod. Phys., 35, 947 [NASA ADS] [CrossRef] [Google Scholar]
- Burtscher, L., Davies, R. I., Graciá-Carpio, J., et al. 2016, A&A, 586, A28 [NASA ADS] [CrossRef] [EDP Sciences] [Google Scholar]
- Calzetti, D. 2011, EAS Publ. Ser., 133 [Google Scholar]
- Capetti, A., Massaro, F., & Baldi, R. D. 2017a, A&A, 601, A81 [NASA ADS] [CrossRef] [EDP Sciences] [Google Scholar]
- Capetti, A., Massaro, F., & Baldi, R. D. 2017b, A&A, 598, A49 [NASA ADS] [CrossRef] [EDP Sciences] [Google Scholar]
- Chiaraluce, E., Bruni, G., Panessa, F., et al. 2019, MNRAS, 485, 3185 [NASA ADS] [CrossRef] [Google Scholar]
- Cid Fernandes, R., Heckman, T., Schmitt, H., et al. 2001, ApJ, 558, 81 [NASA ADS] [CrossRef] [Google Scholar]
- Colless, M., Dalton, G., Maddox, S., et al. 2001, MNRAS, 328, 1039 [Google Scholar]
- Collin-Souffrin, S., Alloin, D., & Andrillat, Y. 1973, A&A, 22, 343 [NASA ADS] [Google Scholar]
- Corral, A., Della Ceca, R., Caccianiga, A., et al. 2011, A&A, 530, A42 [NASA ADS] [CrossRef] [EDP Sciences] [Google Scholar]
- Contini, M., & Viegas, S. M. 2000, ApJ, 535, 721 [NASA ADS] [CrossRef] [Google Scholar]
- Croom, S. M., Smith, R. J., Boyle, B. J., et al. 2004, MNRAS, 349, 1397 [NASA ADS] [CrossRef] [Google Scholar]
- Cusumano, G., La Parola, V., Segreto, A., et al. 2010, A&A, 524, A64 [NASA ADS] [CrossRef] [EDP Sciences] [Google Scholar]
- Cusumano, G., Segreto, A., La Parola, V., et al. 2014, Proceedings of Swift: 10 Years of Discovery (SWIFT), 10, 132 [Google Scholar]
- D’Abrusco, R., Massaro, F., Ajello, M., et al. 2012, ApJ, 748, 68 [CrossRef] [Google Scholar]
- D’Abrusco, R., Massaro, F., Paggi, A., et al. 2013, ApJS, 206, 12 [CrossRef] [Google Scholar]
- D’Abrusco, R., Massaro, F., Paggi, A., et al. 2014, ApJS, 215, 14 [Google Scholar]
- D’Abrusco, R., Álvarez Crespo, N., Massaro, F., et al. 2019, ApJS, 242, 4 [Google Scholar]
- Dahari, O. 1984, AJ, 89, 966 [NASA ADS] [CrossRef] [Google Scholar]
- Davies, R. I., Müller Sánchez, F., Genzel, R., et al. 2007, ApJ, 671, 1388 [Google Scholar]
- de Grijp, M. H. K., Keel, W. C., Miley, G. K., et al. 1992, A&AS, 96, 389 [NASA ADS] [Google Scholar]
- de Menezes, R., Peña-Herazo, H. A., Marchesini, E. J., et al. 2019, A&A, 630, A55 [NASA ADS] [CrossRef] [EDP Sciences] [Google Scholar]
- Denney, K. D., De Rosa, G., Croxall, K., et al. 2014, ApJ, 796, 134 [Google Scholar]
- De Robertis, M. M., Hayhoe, K., & Yee, H. K. C. 1998, ApJS, 115, 163 [NASA ADS] [CrossRef] [Google Scholar]
- Diamond-Stanic, A. M., & Rieke, G. H. 2012, ApJ, 746, 168 [Google Scholar]
- Dressler, A., & Shectman, S. A. 1988, AJ, 95, 284 [Google Scholar]
- Dressler, A., Thompson, I. B., & Shectman, S. A. 1985, ApJ, 288, 481 [NASA ADS] [CrossRef] [Google Scholar]
- Dultzin-Hacyan, D., Krongold, Y., Fuentes-Guridi, I., et al. 1999, ApJ, 513, L111 [NASA ADS] [CrossRef] [Google Scholar]
- Edge, D. O., Shakeshaft, J. R., McAdam, W. B., et al. 1959, MmRAS, 68, 37 [NASA ADS] [Google Scholar]
- Efstathiou, A., & Rowan-Robinson, M. 1995, MNRAS, 273, 649 [Google Scholar]
- Esparza-Arredondo, D., González-Martín, O., Dultzin, D., et al. 2018, ApJ, 859, 124 [NASA ADS] [CrossRef] [Google Scholar]
- Fath, E. A. 1909, LicOB, 149, 71 [NASA ADS] [Google Scholar]
- Fabian, A. C., Guilbert, P. W., Arnaud, K. A., et al. 1986, MNRAS, 218, 457 [NASA ADS] [CrossRef] [Google Scholar]
- Ferland, G. J., & Netzer, H. 1983, ApJ, 264, 105 [NASA ADS] [CrossRef] [Google Scholar]
- Feruglio, C., Fabbiano, G., Bischetti, M., et al. 2020, ApJ, 890, 29 [Google Scholar]
- Fey, A. L., Gordon, D., Jacobs, C. S., et al. 2015, AJ, 150, 58 [Google Scholar]
- Fomalont, E. B., Petrov, L., MacMillan, D. S., et al. 2003, AJ, 126, 2562 [NASA ADS] [CrossRef] [Google Scholar]
- Fuentes-Williams, T., & Stocke, J. T. 1988, AJ, 96, 1235 [NASA ADS] [CrossRef] [Google Scholar]
- Fukugita, M., Ichikawa, T., Gunn, J. E., et al. 1996, AJ, 111, 1748 [Google Scholar]
- Gallimore, J. F., Yzaguirre, A., Jakoboski, J., et al. 2010, ApJS, 187, 172 [NASA ADS] [CrossRef] [Google Scholar]
- Gandhi, P., Horst, H., Smette, A., et al. 2009, A&A, 502, 457 [NASA ADS] [CrossRef] [EDP Sciences] [Google Scholar]
- García-Burillo, S., Combes, F., Usero, A., et al. 2014, A&A, 567, A125 [Google Scholar]
- García-Bernete, I., Ramos Almeida, C., Acosta-Pulido, J. A., et al. 2016, MNRAS, 463, 3531 [CrossRef] [Google Scholar]
- Gaskell, M. 2014, Nat. Phys., 10, 414 [NASA ADS] [CrossRef] [Google Scholar]
- George, I. M., & Fabian, A. C. 1991, MNRAS, 249, 352 [Google Scholar]
- Gliozzi, M., & Williams, J. K. 2020, MNRAS, 491, 532 [Google Scholar]
- González-Martín, O., Masegosa, J., García-Bernete, I., et al. 2019, ApJ, 884, 11 [Google Scholar]
- Gordon, Y. A., Owers, M. S., Pimbblet, K. A., et al. 2017, MNRAS, 465, 2671 [NASA ADS] [CrossRef] [Google Scholar]
- Gower, J. F. R., Scott, P. F., & Wills, D. 1967, MmRAS, 71, 49 [NASA ADS] [Google Scholar]
- Green, R. F. 1976, PASP, 88, 665 [NASA ADS] [CrossRef] [Google Scholar]
- Green, R. F., Schmidt, M., & Liebert, J. 1986, ApJS, 61, 305 [NASA ADS] [CrossRef] [Google Scholar]
- Haardt, F., & Maraschi, L. 1991, ApJ, 380, L51 [Google Scholar]
- Hao, L., Weedman, D. W., Spoon, H. W. W., et al. 2007, ApJ, 655, L77 [NASA ADS] [CrossRef] [Google Scholar]
- Haro, G. 1956, Bol. Obs. Tonantzintla Tacubaya, 2, 8 [NASA ADS] [Google Scholar]
- Hayashida, M., Stawarz, Ł., Cheung, C. C., et al. 2013, ApJ, 779, 131 [NASA ADS] [CrossRef] [Google Scholar]
- Heckman, T. M. 1978, PASP, 90, 241 [NASA ADS] [CrossRef] [Google Scholar]
- Heckman, T. M. 1980, A&A, 500, 187 [Google Scholar]
- Heckman, T. M., & Best, P. N. 2014, ARA&A, 52, 589 [Google Scholar]
- Ho, L. C. 2008, ARA&A, 46, 475 [Google Scholar]
- Ho, L. C., & Ulvestad, J. S. 2001, ApJS, 133, 77 [NASA ADS] [CrossRef] [Google Scholar]
- Ho, L. C., Filippenko, A. V., & Sargent, W. L. 1995, ApJS, 98, 477 [NASA ADS] [CrossRef] [Google Scholar]
- Ho, L. C., Filippenko, A. V., Sargent, W. L. W., & Peng, C. Y. 1997, ApJS, 112, 391 [NASA ADS] [CrossRef] [Google Scholar]
- Ho, L. C., Filippenko, A. V., & Sargent, W. L. W. 2003, ApJ, 583, 159 [NASA ADS] [CrossRef] [Google Scholar]
- Hoyle, F., & Fowler, W. A. 1963, Nature, 197, 533 [Google Scholar]
- Hubble, E. P. 1926, ApJ, 64, 321 [Google Scholar]
- Huchra, J., & Burg, R. 1992, ApJ, 393, 90 [NASA ADS] [CrossRef] [Google Scholar]
- Huchra, J. P., Vogeley, M. S., & Geller, M. J. 1999, ApJS, 121, 287 [Google Scholar]
- Humason, M. L. 1932, PASP, 44, 267 [NASA ADS] [CrossRef] [Google Scholar]
- Ichikawa, K., Ricci, C., Ueda, Y., et al. 2017, ApJ, 835, 74 [NASA ADS] [CrossRef] [Google Scholar]
- Ichikawa, K., Ricci, C., Ueda, Y., et al. 2019, ApJ, 870, 31 [NASA ADS] [CrossRef] [Google Scholar]
- Jiang, N., Wang, H., Mo, H., et al. 2016, ApJ, 832, 111 [Google Scholar]
- Jensen, J. J., Hönig, S. F., Rakshit, S., et al. 2017, MNRAS, 470, 3071 [NASA ADS] [CrossRef] [Google Scholar]
- Jones, D. H., Saunders, W., Colless, M., et al. 2004, MNRAS, 355, 747 [NASA ADS] [CrossRef] [Google Scholar]
- Kauffmann, G., Heckman, T. M., Tremonti, C., et al. 2003, MNRAS, 346, 1055 [Google Scholar]
- Keel, W. C. 1980, AJ, 85, 198 [Google Scholar]
- Kewley, L. J., Dopita, M. A., Sutherland, R. S., et al. 2001, ApJ, 556, 121 [Google Scholar]
- Kewley, L. J., Groves, B., Kauffmann, G., et al. 2006, MNRAS, 372, 961 [NASA ADS] [CrossRef] [Google Scholar]
- Khachikian, E. E., & Weedman, D. W. 1971, Astrofizika, 7, 389 [NASA ADS] [Google Scholar]
- Khachikian, E. Y., & Weedman, D. W. 1974, ApJ, 192, 581 [NASA ADS] [CrossRef] [Google Scholar]
- Koski, A. T. 1978, ApJ, 223, 56 [NASA ADS] [CrossRef] [Google Scholar]
- Koss, M., Trakhtenbrot, B., Ricci, C., et al. 2017, ApJ, 850, 74 [Google Scholar]
- Kotilainen, J. K., & Ward, M. J. 1994, MNRAS, 266, 953 [NASA ADS] [CrossRef] [Google Scholar]
- Koulouridis, E., Plionis, M., Chavushyan, V., et al. 2006, ApJ, 639, 37 [Google Scholar]
- LaMassa, S. M., Heckman, T. M., Ptak, A., et al. 2012, ApJ, 758, 1 [NASA ADS] [CrossRef] [Google Scholar]
- LaMassa, S. M., Cales, S., Moran, E. C., et al. 2015, ApJ, 800, 144 [NASA ADS] [CrossRef] [Google Scholar]
- Landoni, M., Massaro, F., Paggi, A., et al. 2015, AJ, 149, 163 [Google Scholar]
- Laurikainen, E., & Salo, H. 1995, A&A, 293, 683 [NASA ADS] [Google Scholar]
- Lebouteiller, V., Barry, D. J., Spoon, H. W. W., et al. 2011, ApJS, 196, 8 [NASA ADS] [CrossRef] [Google Scholar]
- Lebouteiller, V., Barry, D. J., Goes, C., et al. 2015, ApJS, 218, 21 [Google Scholar]
- Lintott, C. J., Schawinski, K., Slosar, A., et al. 2008, MNRAS, 389, 1179 [NASA ADS] [CrossRef] [Google Scholar]
- Lipovetsky, V. A., Neizvestnyj, S. I., & Neizvestnaya, O. M. 1987, Soobshcheniya Spetsial’noj Astrofizicheskoj Observatorii, 55 [Google Scholar]
- Lipovetsky, V. A., Neizvestny, S. I., & Neizvestnaya, O. M. 1988, Soobshcheniya Spetsial’noj Astrofizicheskoj Observatorii, 55, 5 [NASA ADS] [Google Scholar]
- Lutz, D., Maiolino, R., Spoon, H. W. W., et al. 2004, A&A, 418, 465 [NASA ADS] [CrossRef] [EDP Sciences] [Google Scholar]
- MacKenty, J. W. 1989, ApJ, 343, 125 [NASA ADS] [CrossRef] [Google Scholar]
- MacKenty, J. W. 1990, ApJS, 72, 231 [NASA ADS] [CrossRef] [Google Scholar]
- Maiolino, R., & Rieke, G. H. 1995, ApJ, 454, 95 [Google Scholar]
- Maiolino, R., Salvati, M., Bassani, L., et al. 1998, A&A, 338, 781 [NASA ADS] [Google Scholar]
- Mantovani, G., Nandra, K., & Ponti, G. 2016, MNRAS, 458, 4198 [NASA ADS] [CrossRef] [Google Scholar]
- Marchesi, S., Kaur, A., & Ajello, M. 2018, AJ, 156, 212 [NASA ADS] [CrossRef] [Google Scholar]
- Marchesini, E. J., Masetti, N., Chavushyan, V., et al. 2016, A&A, 596, A10 [NASA ADS] [CrossRef] [EDP Sciences] [Google Scholar]
- Marchesini, E. J., Peña-Herazo, H. A., Álvarez Crespo, N., et al. 2019a, Ap&SS, 364, 5 [NASA ADS] [CrossRef] [Google Scholar]
- Marchesini, E. J., Masetti, N., Palazzi, E., et al. 2019b, Ap&SS, 364, 153 [NASA ADS] [CrossRef] [Google Scholar]
- Markarian, B. E. 1967, Astrofizika, 3 [Google Scholar]
- Markarian, B. E., Lipovetsky, V. A., Stepanian, J. A., et al. 1989, Soobshcheniya Spetsial’noj Astrofizicheskoj Observatorii, 62, 5 [Google Scholar]
- Markowitz, A., Reeves, J. N., Miniutti, G., et al. 2008, PASJ, 60, S277 [NASA ADS] [CrossRef] [Google Scholar]
- Masetti, N., Palazzi, E., Bassani, L., et al. 2004, A&A, 426, L41 [NASA ADS] [CrossRef] [EDP Sciences] [Google Scholar]
- Masetti, N., Mason, E., Bassani, L., et al. 2006, A&A, 448, 547 [NASA ADS] [CrossRef] [EDP Sciences] [Google Scholar]
- Masetti, N., Mason, E., Morelli, L., et al. 2008, A&A, 482, 113 [NASA ADS] [CrossRef] [EDP Sciences] [Google Scholar]
- Masetti, N., Parisi, P., Palazzi, E., et al. 2009, A&A, 495, 121 [NASA ADS] [CrossRef] [EDP Sciences] [Google Scholar]
- Masetti, N., Parisi, P., Palazzi, E., et al. 2010, A&A, 519, A96 [NASA ADS] [CrossRef] [EDP Sciences] [Google Scholar]
- Masetti, N., Parisi, P., Jiménez-Bailón, E., et al. 2012, A&A, 538, A123 [NASA ADS] [CrossRef] [EDP Sciences] [Google Scholar]
- Masetti, N., Parisi, P., Palazzi, E., et al. 2013, A&A, 556, A120 [NASA ADS] [CrossRef] [EDP Sciences] [Google Scholar]
- Mason, R. E., Levenson, N. A., Shi, Y., et al. 2009, ApJ, 693, L136 [Google Scholar]
- Massaro, F., & D’Abrusco, R. 2016, ApJ, 827, 67 [NASA ADS] [CrossRef] [Google Scholar]
- Massaro, F., Bianchi, S., Matt, G., et al. 2006, A&A, 455, 153 [NASA ADS] [CrossRef] [EDP Sciences] [Google Scholar]
- Massaro, E., Giommi, P., Leto, C., et al. 2009, A&A, 495, 691 [CrossRef] [EDP Sciences] [Google Scholar]
- Massaro, F., D’Abrusco, R., Ajello, M., et al. 2011, ApJ, 740, L48 [NASA ADS] [CrossRef] [Google Scholar]
- Massaro, F., D’Abrusco, R., Tosti, G., et al. 2012a, ApJ, 750, 138 [NASA ADS] [CrossRef] [Google Scholar]
- Massaro, F., D’Abrusco, R., Tosti, G., et al. 2012b, ApJ, 752, 61 [NASA ADS] [CrossRef] [Google Scholar]
- Massaro, F., D’Abrusco, R., Paggi, A., et al. 2013a, ApJS, 206, 13 [NASA ADS] [CrossRef] [Google Scholar]
- Massaro, F., D’Abrusco, R., Paggi, A., et al. 2013b, ApJS, 209, 10 [NASA ADS] [CrossRef] [Google Scholar]
- Massaro, F., Masetti, N., D’Abrusco, R., et al. 2014, AJ, 148, 66 [NASA ADS] [CrossRef] [Google Scholar]
- Massaro, E., Maselli, A., Leto, C., et al. 2015a, Ap&SS, 357, 75 [Google Scholar]
- Massaro, F., D’Abrusco, R., Landoni, M., et al. 2015b, ApJS, 217, 2 [NASA ADS] [CrossRef] [Google Scholar]
- Massaro, F., Landoni, M., D’Abrusco, R., et al. 2015c, A&A, 575, A124 [NASA ADS] [CrossRef] [EDP Sciences] [Google Scholar]
- Massaro, F., Álvarez Crespo, N., D’Abrusco, R., et al. 2016, Ap&SS, 361, 337 [Google Scholar]
- Massaro, F., Álvarez-Crespo, N., Capetti, A., et al. 2019, ApJS, 240, 20 [NASA ADS] [CrossRef] [Google Scholar]
- Massaro, F., Capetti, A., Paggi, A., et al. 2020, ApJS, 247, 71 [Google Scholar]
- Matt, G. 1997, Mem. Soc. Astron. It., 68, 127 [NASA ADS] [Google Scholar]
- Matt, G., Brandt, W. N., & Fabian, A. C. 1996, MNRAS, 280, 823 [NASA ADS] [CrossRef] [Google Scholar]
- Matt, G., Guainazzi, M., & Maiolino, R. 2003, MNRAS, 342, 422 [NASA ADS] [CrossRef] [Google Scholar]
- Mayall, N. U. 1934, PASP, 46, 134 [NASA ADS] [CrossRef] [Google Scholar]
- Mehdipour, M., Branduardi-Raymont, G., Kaastra, J. S., et al. 2011, A&A, 534, A39 [NASA ADS] [CrossRef] [EDP Sciences] [Google Scholar]
- Menezes, R. B., da Silva, P., & Steiner, J. E. 2018, MNRAS, 473, 2198 [NASA ADS] [CrossRef] [Google Scholar]
- Merloni, A., Bongiorno, A., Brusa, M., et al. 2014, MNRAS, 437, 3550 [Google Scholar]
- Mor, R., Netzer, H., & Elitzur, M. 2009, ApJ, 705, 298 [Google Scholar]
- Morganti, R., Oosterloo, T., Oonk, J. B. R., et al. 2015, A&A, 580, A1 [NASA ADS] [CrossRef] [EDP Sciences] [Google Scholar]
- Mulchaey, J. S., Koratkar, A., Ward, M. J., et al. 1994, ApJ, 436, 586 [NASA ADS] [CrossRef] [Google Scholar]
- Mushotzky, R. F., Marshall, F. E., Boldt, E. A., et al. 1980, ApJ, 235, 377 [NASA ADS] [CrossRef] [Google Scholar]
- Nandra, K., & Pounds, K. A. 1994, MNRAS, 268, 405 [Google Scholar]
- Nenkova, M., Sirocky, M. M., Nikutta, R., et al. 2008, ApJ, 685, 160 [Google Scholar]
- Oh, K., Koss, M., Markwardt, C. B., et al. 2018, ApJS, 235, 4 [Google Scholar]
- Ordovás-Pascual, I., Mateos, S., Carrera, F. J., et al. 2017, MNRAS, 469, 693 [NASA ADS] [Google Scholar]
- Osterbrock, D. E. 1981, ApJ, 249, 462 [Google Scholar]
- Osterbrock, D. E., & Martel, A. 1993, ApJ, 414, 552 [Google Scholar]
- Osterbrock, D. E., & Parker, R. A. R. 1965, ApJ, 141, 892 [NASA ADS] [CrossRef] [Google Scholar]
- Osterbrock, D. E., & Pogge, R. W. 1985, ApJ, 297, 166 [Google Scholar]
- Pacholczyk, A. G., & Weymann, R. 1968, AJ, 73, 836 [NASA ADS] [CrossRef] [Google Scholar]
- Paggi, A., Milisavljevic, D., Masetti, N., et al. 2014, AJ, 147, 112 [NASA ADS] [CrossRef] [Google Scholar]
- Paiano, S., Landoni, M., Falomo, R., et al. 2017, ApJ, 844, 120 [NASA ADS] [CrossRef] [Google Scholar]
- Paiano, S., Falomo, R., Treves, A., et al. 2019, ApJ, 871, 162 [NASA ADS] [CrossRef] [Google Scholar]
- Panessa, F., & Bassani, L. 2002, A&A, 394, 435 [NASA ADS] [CrossRef] [EDP Sciences] [Google Scholar]
- Panessa, F., Bassani, L., Cappi, M., et al. 2006, A&A, 455, 173 [NASA ADS] [CrossRef] [EDP Sciences] [Google Scholar]
- Panessa, F., Baldi, R. D., Laor, A., et al. 2019, Nat. Astron., 3, 387 [Google Scholar]
- Pappa, A., Georgantopoulos, I., Stewart, G. C., et al. 2001, MNRAS, 326, 995 [NASA ADS] [CrossRef] [Google Scholar]
- Parisi, P., Masetti, N., Jiménez-Bailón, E., et al. 2012, A&A, 545, A101 [NASA ADS] [CrossRef] [EDP Sciences] [Google Scholar]
- Patrick, A. R., Reeves, J. N., Porquet, D., et al. 2012, MNRAS, 426, 2522 [NASA ADS] [CrossRef] [Google Scholar]
- Peeters, E., Spoon, H. W. W., & Tielens, A. G. G. M. 2004, ApJ, 613, 986 [NASA ADS] [CrossRef] [Google Scholar]
- Peña-Herazo, H. A., Marchesini, E. J., Álvarez Crespo, N., et al. 2017, Ap&SS, 362, 228 [CrossRef] [Google Scholar]
- Peña-Herazo, H. A., Massaro, F., Chavushyan, V., et al. 2019, Ap&SS, 364, 85 [CrossRef] [Google Scholar]
- Petrosian, A. R. 1982, Astrofizika, 18, 548 [NASA ADS] [Google Scholar]
- Pietsch, W., Bischoff, K., Boller, T., et al. 1998, A&A, 333, 48 [NASA ADS] [Google Scholar]
- Pilkington, J. D. H., & Scott, J. F. 1965, MmRAS, 69, 183 [Google Scholar]
- Pogge, R. W. 1988, ApJ, 332, 702 [NASA ADS] [CrossRef] [Google Scholar]
- Predehl, P. 2017, Astron. Nachr., 338, 159 [NASA ADS] [CrossRef] [Google Scholar]
- Rafanelli, P., & Schulz, H. 1991, Astron. Nachr., 312, 167 [NASA ADS] [CrossRef] [Google Scholar]
- Rafanelli, P., Violato, M., & Baruffolo, A. 1995, AJ, 109, 1546 [NASA ADS] [CrossRef] [Google Scholar]
- Raimundo, S. I., Vestergaard, M., Koay, J. Y., et al. 2019, MNRAS, 486, 123 [Google Scholar]
- Ramos Almeida, C., Pérez García, A. M., Acosta-Pulido, J. A., et al. 2007, AJ, 134, 2006 [NASA ADS] [CrossRef] [Google Scholar]
- Ricci, C., Ueda, Y., Koss, M. J., et al. 2015, ApJ, 815, L13 [Google Scholar]
- Rieke, G. H. 1978, ApJ, 226, 550 [Google Scholar]
- Risaliti, G., Maiolino, R., & Salvati, M. 1999, ApJ, 522, 157 [Google Scholar]
- Roche, P. F., Packham, C., Aitken, D. K., et al. 2007, MNRAS, 375, 99 [NASA ADS] [CrossRef] [Google Scholar]
- Rojas, A. F., Masetti, N., Minniti, D., et al. 2017, A&A, 602, A124 [NASA ADS] [CrossRef] [EDP Sciences] [Google Scholar]
- Ruschel-Dutra, D., Pastoriza, M., Riffel, R., et al. 2014, MNRAS, 438, 3434 [NASA ADS] [CrossRef] [Google Scholar]
- Ruschel-Dutra, D., Rodríguez Espinosa, J. M., González Martín, O., et al. 2017, MNRAS, 466, 3353 [NASA ADS] [CrossRef] [Google Scholar]
- Salvato, M., & Rafanelli, P. 1997, Astron. Nachr., 318, 237 [NASA ADS] [CrossRef] [Google Scholar]
- Sandage, A., & Tammann, G. A. 1987, A revised Shapley-Ames Catalog of bright galaxies (Carnegie Institution of Washington Publication) [Google Scholar]
- Sani, E., Lutz, D., Risaliti, G., et al. 2010, MNRAS, 403, 1246 [Google Scholar]
- Sargent, W. L. W. 1970, ApJ, 160, 405 [NASA ADS] [CrossRef] [Google Scholar]
- Sazonov, S., Willner, S. P., Goulding, A. D., et al. 2012, ApJ, 757, 181 [NASA ADS] [CrossRef] [Google Scholar]
- Schawinski, K., Thomas, D., Sarzi, M., et al. 2007, MNRAS, 382, 1415 [Google Scholar]
- Schmidt, M. 1963, Nature, 197, 1040 [Google Scholar]
- Schmidt, M., & Green, R. F. 1983, ApJ, 269, 352 [NASA ADS] [CrossRef] [Google Scholar]
- Sebastian, B., Kharb, P., O’Dea, C. P., et al. 2020, MNRAS, 499, 334 [NASA ADS] [CrossRef] [Google Scholar]
- Segreto, A., Cusumano, G., Ferrigno, C., et al. 2010, A&A, 510, A47 [NASA ADS] [CrossRef] [EDP Sciences] [Google Scholar]
- Seyfert, C. K. 1943, ApJ, 97, 28 [NASA ADS] [CrossRef] [Google Scholar]
- Shappee, B. J., Prieto, J. L., Grupe, D., et al. 2014, ApJ, 788, 48 [Google Scholar]
- Shi, Y., Rieke, G. H., Smith, P., et al. 2010, ApJ, 714, 115 [NASA ADS] [CrossRef] [Google Scholar]
- Siebenmorgen, R., Heymann, F., & Efstathiou, A. 2015, A&A, 583, A120 [NASA ADS] [CrossRef] [EDP Sciences] [Google Scholar]
- Singh, V., Shastri, P., & Risaliti, G. 2011, A&A, 532, A84 [NASA ADS] [CrossRef] [EDP Sciences] [Google Scholar]
- Simkin, S. M., Su, H. J., & Schwarz, M. P. 1980, ApJ, 237, 404 [NASA ADS] [CrossRef] [Google Scholar]
- Slipher, V. M. 1917, Lowell Obs. Bull., 3, 59 [NASA ADS] [Google Scholar]
- Souchay, J., Andrei, A. H., Barache, C., et al. 2009, A&A, 494, 799 [NASA ADS] [CrossRef] [EDP Sciences] [Google Scholar]
- Stasińska, G. 1984, A&A, 135, 341 [NASA ADS] [Google Scholar]
- Stasińska, G., Cid Fernandes, R., Mateus, A., et al. 2006, MNRAS, 371, 972 [CrossRef] [Google Scholar]
- Stern, D., Assef, R. J., Benford, D. J., et al. 2012, ApJ, 753, 30 [Google Scholar]
- Storchi-Bergmann, T., Fernandes, R. C., & Schmitt, H. R. 1998, ApJ, 501, 94 [NASA ADS] [CrossRef] [Google Scholar]
- Sturm, E., Schweitzer, M., Lutz, D., et al. 2005, ApJ, 629, L21 [Google Scholar]
- Taylor, M. B. 2005, ASPC, 347, 29 [Google Scholar]
- Treister, E., Castander, F. J., Maccarone, T. J., et al. 2005, ApJ, 621, 104 [NASA ADS] [CrossRef] [Google Scholar]
- Tristram, K. R. W., Meisenheimer, K., Jaffe, W., et al. 2007, A&A, 474, 837 [NASA ADS] [CrossRef] [EDP Sciences] [Google Scholar]
- Tueller, J., Mushotzky, R. F., Barthelmy, S., et al. 2008, ApJ, 681, 113 [NASA ADS] [CrossRef] [Google Scholar]
- Urry, C. M., & Padovani, P. 1995, PASP, 107, 803 [NASA ADS] [CrossRef] [Google Scholar]
- Veilleux, S., & Osterbrock, D. E. 1987, ApJS, 63, 295 [Google Scholar]
- Villarroel, B., & Korn, A. J. 2014, Nat. Phys., 10, 417 [Google Scholar]
- Veron-Cetty, M.-P., & Veron, P. 1989, ESO Scientific Report [Google Scholar]
- Véron-Cetty, M.-P., & Véron, P. 2006, A&A, 455, 773 [NASA ADS] [CrossRef] [EDP Sciences] [Google Scholar]
- Véron-Cetty, M.-P., & Véron, P. 2010, A&A, 518, A10 [NASA ADS] [CrossRef] [EDP Sciences] [Google Scholar]
- Voges, W., Aschenbach, B., Boller, T., et al. 1999, A&A, 349, 389 [NASA ADS] [Google Scholar]
- Voges, W., Aschenbach, B., Boller, T., et al. 2000, VizieR Online Data Catalog:IX/29 [Google Scholar]
- Walter, R., & Fink, H. H. 1993, A&A, 274, 105 [NASA ADS] [Google Scholar]
- Weedman, D. W. 1976, QJRAS, 17, 22 [NASA ADS] [Google Scholar]
- Weedman, D. W. 1977, ARA&A, 15, 69 [NASA ADS] [CrossRef] [Google Scholar]
- Wojaczyński, R., Niedźwiecki, A., Xie, F.-G., et al. 2015, A&A, 584, A20 [NASA ADS] [CrossRef] [EDP Sciences] [Google Scholar]
- Woltjer, L. 1959, ApJ, 130, 38 [NASA ADS] [CrossRef] [Google Scholar]
- Wright, E. L., Eisenhardt, P. R. M., Mainzer, A. K., et al. 2010, AJ, 140, 1868 [Google Scholar]
- Xanthopoulos, E. 1996, MNRAS, 280, 6 [NASA ADS] [CrossRef] [Google Scholar]
- Xie, Y., Li, A., & Hao, L. 2017, ApJS, 228, 6 [Google Scholar]
- Yee, H. K. 1983, ApJ, 272, 473 [NASA ADS] [CrossRef] [Google Scholar]
- Zechlin, H.-S., & Horns, D. 2012, J. Cosmol. Astropart. Phys., 2012, 050 [Google Scholar]
Appendix A: SyCAT tables
Here we report the first five rows for each table of the Turin-SyCAT as described in the following.
In Table A.1 there are all 351 Turin-SyCAT sources with (i) their unique catalog identification number (ID); (ii) their SyCAT name; (iii,iv,v) radio names from the SUMSS and NVSS catalogs if a counterpart is present; (vi) name of the unique WISE counterpart as well as (vii) that in the optical from the Pan-STARRS if in the footprint above a declination of ∼33 °; and (viii,ix,x,xi) X-ray names from ROSAT, 3PBC, BAT105, and IBIS4CAT, respectively. This table is extremely important to carry out cross-matches easily with other catalogs, surveys, and/or samples.
All Turin-SyCAT sources with names of their counterparts in the catalogs/surveys explored (first five rows, full table available at the CDS)
Table A.2 reports the main properties of the catalog as (i) unique catalog ID; (ii) SyCAT name; (iii) name of the mid-IR WISE counterpart; (iv,v) WISE coordinates; (vi,vii) redshift and luminosity distance computed according to the chosen cosmology, respectively; (viii) the type 1 or type 2 classification provided by our analysis; (ix) the reference for the redshift; and (x,xi) the class indicated in the literature and the reference for it.
First release of the Turin-SyCAT (first five rows; full table available at the CDS)
In Table A.3 we provide all the information regarding the mid-IR properties, such as all WISE and 2MASS magnitudes, including their uncertainties, and the LW1 luminosity used to avoid quasar selection compared to the 1011 L⊙ threshold.
Mid-IR and near-IR properties of Turin-SyCAT sources (first five rows; full table available at the CDS)
The main optical information (i.e., magnitudes and spectral classification, if any) concerning the cross-matches obtained with the SDSS, and the Pan-STARRS databases are reported in Table A.4, together with their (1) unique ID; (2) SyCAT name; (3) name in Pan-STARRS survey. Columns(4), (5), (6), (7), and (8) are the PSF magnitudes from Pan-STARRS in g, r, i, z, and y bands and their uncertainties in parentheses. The following columns contain SDSS information: (9) flag of presence in SDSS; (10) magnitude from SDSS in u band and its 1σ uncertainty in parentheses; (11) spectroscopic redshift; (12) automatic classification; and (13) automatic subclassification. This information is provided only for Seyfert galaxies lying in the Pan-STARRS footprint.
Optical properties of Turin-SyCAT sources (first five rows; full table available at the CDS)
Finally, in Table A.5, we report all the parameters related to the X-ray counterparts of the Turin-SyCAT sources collected from the ROSAT, 3PBC, BAT105, and IBSI4CAT catalogs. This information is shown in the table only for those sources having at least one X-ray counterpart in one of the surveys previously indicated and again the (i) unique ID; (ii) SyCAT name; (iii) name of the mid-IR WISE counterpart are in the first three columns.
X-ray properties of Turin-SyCAT sources (first five rows; full table available at the CDS)
Appendix B: Color dependence on redshift
In this appendix we compare the dependence on redshift in the WISE color-color space for both Seyfert types. We present in Figures B.1 to B.6 the WISE colors w1-w2 versus w2-w3, and w3-w4 versus w2w3, as in Figure 7, but for different redshifts bins to show that the behavior of the two populations does not change with redshift. Up to redshift 0.1, where we have type 2, both populations are clearly separated in the w1-w2 versus w2-w3 color-color plot.
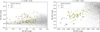 |
Fig. B.1. Color-color diagrams based on the WISE magnitudes comparing Seyfert galaxies of type 1 (black) and type 2 (yellow) with generic mid-IR sources selected in a random region of the sky (see Massaro et al. 2011, 2013a,b, 2016, for a similar analysis). Seyfert galaxies of type 2 appear to be redder than those of type 1, and are separated in the w1-w2 vs. w2-w3 color-color plot in the lower left corner. |
In Figure B.7 we explore the WISE color-color space for the subsample of Seyfert galaxies above the 90% identification fraction included in 3PBC.
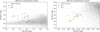 |
Fig. B.7. Subsample with 90 % of Seyfert galaxies above 90 % identification fraction in the 3PBC catalog. The color-coding is the same as in Figure B.1. |
All Tables
Number of sources in the starting catalogs or samples for the initial Seyfert galaxy selection.
All Turin-SyCAT sources with names of their counterparts in the catalogs/surveys explored (first five rows, full table available at the CDS)
First release of the Turin-SyCAT (first five rows; full table available at the CDS)
Mid-IR and near-IR properties of Turin-SyCAT sources (first five rows; full table available at the CDS)
Optical properties of Turin-SyCAT sources (first five rows; full table available at the CDS)
X-ray properties of Turin-SyCAT sources (first five rows; full table available at the CDS)
All Figures
|
Fig. 1. Identification fraction of sources listed in the 3PBC computed as the ratio of the number of unidentified sources (Nunid) to the total number of sources (Nsrc) with flux in the hard X-ray band 15–150 keV, above a certain threshold. The blue and red lines indicate the hard X-ray flux for which the 3PBC has 90 and 95% identification, respectively. About 85% of the sources in the 3PBC appear to have an optical spectroscopic classification. |
| In the text | |
|
Fig. 2. Flow chart highlighting all steps and thresholds applied to select the final sample of Seyfert galaxies belonging to the first release of the Turin-SyCAT. We selected sources with radio luminosity lower than 1040 erg s−1 to avoid jetted AGNs and L3.4 μm < 1011 L⊙ to avoid quasars. |
| In the text | |
|
Fig. 3. Example of optical spectra of type 1 and type 2 Seyfert galaxies. Left panel: optical spectrum of a classical type 1 Seyfert galaxy: SY1 J0935+2617 (also known as SDSS J093527.09+261709.6) listed in the Turin-SyCAT where broad emission lines are clearly seen in the range 4000 − 9000 Å as indicated. Right panel: same as left panel, but for a typical type 2 Seyfert galaxy: SY2 J1135+5657 (SDSS J113549.08+565708.2), lacking broad emission lines. The main spectral emission and/or absorption features are labeled in both figures, thus providing clear examples of those spectra searched for in the literature to prepare the Turin-SyCAT. |
| In the text | |
|
Fig. 4. Redshift distribution of all Seyfert galaxies included in the first release of the Turin-SyCAT. Seyfert galaxies classified as type 1 are shown in black, while those classified as type 2 are in yellow. (This color scheme is adopted through the entire manuscript). It is worth noting that type 2 Seyferts are basically not selected at z > 0.1. |
| In the text | |
|
Fig. 5. Sky distribution of all 351 Seyfert galaxies listed in the Turin-SyCAT, in the Aitoff projection. Seyfert 1 are represented as black stars and Seyfert 2 as yellow circles. |
| In the text | |
|
Fig. 6. Venn diagram of sources selected for Turin-SyCAT and associated in both the 3PBC and the BAT105, highlighting those discovered thanks to the optical spectroscopic campaign of unidentified hard X-ray sources, is shown. |
| In the text | |
|
Fig. 7. Color-color diagrams based on the WISE magnitudes comparing Seyfert galaxies of type 1 (black) and type 2 (yellow) with generic mid-IR sources selected in a random region of the sky (see Massaro et al. 2011, 2013a,b, 2016, for a similar analysis). Seyfert galaxies of type 2 appear to be redder than those of type 1, and are quite separated in the W1–W2 vs. W2–W3 color-color plot in the left lower. |
| In the text | |
|
Fig. 8. Comparison between the mid-IR colors of Seyfert galaxies listed in the Turin-SyCAT and the γ-ray blazars of the Roma-BZCAT. Seyfert 1 galaxies tend to be more similar to blazars in their mid-IR emission, in particular when compared with BZQs that have the same infrared and optical properties of normal quasars, while Seyfert 2 galaxies show mid-IR properties similar to BZQs only in the W2–W3 vs. W3–W4 diagram. |
| In the text | |
|
Fig. 9. Color-color diagrams based on the 2MASS magnitudes comparing contours of Seyfert galaxies of type 1 (gray-to-black) and type 2 (yellow-to-green) with generic sources selected in a random region of the sky (see Massaro et al. 2011, for a similar analysis). While Seyfert galaxies occupy a distinct region from that of generic infrared sources their near-IR properties are quite similar. Isodensity contours are computed using KDE (see, e.g., D’Abrusco et al. 2019). |
| In the text | |
|
Fig. 10. Comparison between the optical and the mid-IR (left panel) and near-IR (right panel) colors for both Seyfert galaxies of type 1 (black in both plots) and type 2 (yellow in both plots). Seyfert galaxies are clearly separated in two distinct regions of both plots when considering the u − r color. These color-color diagrams are drawn only for those Seyfert galaxies lying in the SDSS footprint (see Sect. 3). |
| In the text | |
|
Fig. 11. Distributions of the ratios between the integrated flux in the WISE band centered at the nominal wavelength of 12 μm (top panel) and 22 μm (bottom panel), over the integrated flux in the hard X-ray band FHX between 15 and 150 keV collected for all Seyfert galaxies with a counterpart in the 3PBC and selected to belong to the Turin-SyCAT. There is no clear difference between the distributions of type 1 and type 2 Seyfert galaxies appearing in black and yellow, respectively. |
| In the text | |
|
Fig. 12. Mid-IR fluxes at 12 μm and 22 μm as a function of hard X-rays flux. Left panel: Correlation found between the W3 integrated flux and that in the hard X-ray band from the 3PBC, for both Seyfert 1 and 2 galaxies (marked in black and yellow, respectively). The dashed black line corresponds to the regression line computed for the whole sample while the straight black and yellow lines mark that for type 1 and type 2 Seyfert galaxies, respectively. The correlation coefficients are reported in Sect. 5.3, while the p-chance values are negligible, all being lower than 10−6. Right panel: same as left plot, but computed using the mid-IR flux at 22 μm. The vertical dashed blue and red lines indicate the flux at which the sample is complete to 90% and 95%, respectively. |
| In the text | |
|
Fig. 13. Far-IR fluxes at 60 μm and 100 μm as a function of hard X-rays flux. Left panel: Scatter plot for the integrated flux at 60 μm collected from the IRAS Point source catalog (i.e., F60) and that in the hard X-ray band (i.e., FHX), as listed in the 3PBC, for both Seyfert 1 and 2 galaxies (marked in black and yellow, respectively, as shown in previous figures). No clear trend or correlation is evident. Right panel: same as left plot, but computed using the far-IR flux at 100 μm (i.e., F100). |
| In the text | |
|
Fig. B.1. Color-color diagrams based on the WISE magnitudes comparing Seyfert galaxies of type 1 (black) and type 2 (yellow) with generic mid-IR sources selected in a random region of the sky (see Massaro et al. 2011, 2013a,b, 2016, for a similar analysis). Seyfert galaxies of type 2 appear to be redder than those of type 1, and are separated in the w1-w2 vs. w2-w3 color-color plot in the lower left corner. |
| In the text | |
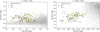 |
Fig. B.2. Same as Figure B.1, but for sources in the redshift range of 0.02 to 0.04. |
| In the text | |
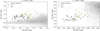 |
Fig. B.3. Same as Figure B.1, but for sources in the redshift range of 0.04 to 0.06. |
| In the text | |
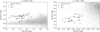 |
Fig. B.4. Same as Figure B.1, but for sources in the redshift range of 0.06 to 0.08. |
| In the text | |
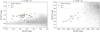 |
Fig. B.5. Same as Figure B.1, but for sources in the redshift range of 0.08 to 0.1. |
| In the text | |
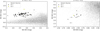 |
Fig. B.6. Same as Figure B.1, but for sources in the redshift range of 0.1 to 0.3. |
| In the text | |
|
Fig. B.7. Subsample with 90 % of Seyfert galaxies above 90 % identification fraction in the 3PBC catalog. The color-coding is the same as in Figure B.1. |
| In the text | |
Current usage metrics show cumulative count of Article Views (full-text article views including HTML views, PDF and ePub downloads, according to the available data) and Abstracts Views on Vision4Press platform.
Data correspond to usage on the plateform after 2015. The current usage metrics is available 48-96 hours after online publication and is updated daily on week days.
Initial download of the metrics may take a while.