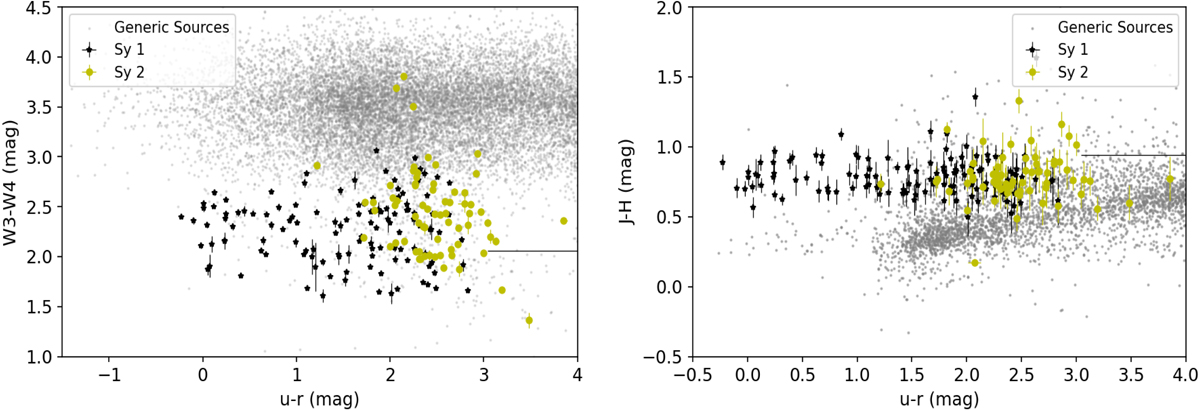
Fig. 10.
Download original image
Comparison between the optical and the mid-IR (left panel) and near-IR (right panel) colors for both Seyfert galaxies of type 1 (black in both plots) and type 2 (yellow in both plots). Seyfert galaxies are clearly separated in two distinct regions of both plots when considering the u − r color. These color-color diagrams are drawn only for those Seyfert galaxies lying in the SDSS footprint (see Sect. 3).
Current usage metrics show cumulative count of Article Views (full-text article views including HTML views, PDF and ePub downloads, according to the available data) and Abstracts Views on Vision4Press platform.
Data correspond to usage on the plateform after 2015. The current usage metrics is available 48-96 hours after online publication and is updated daily on week days.
Initial download of the metrics may take a while.