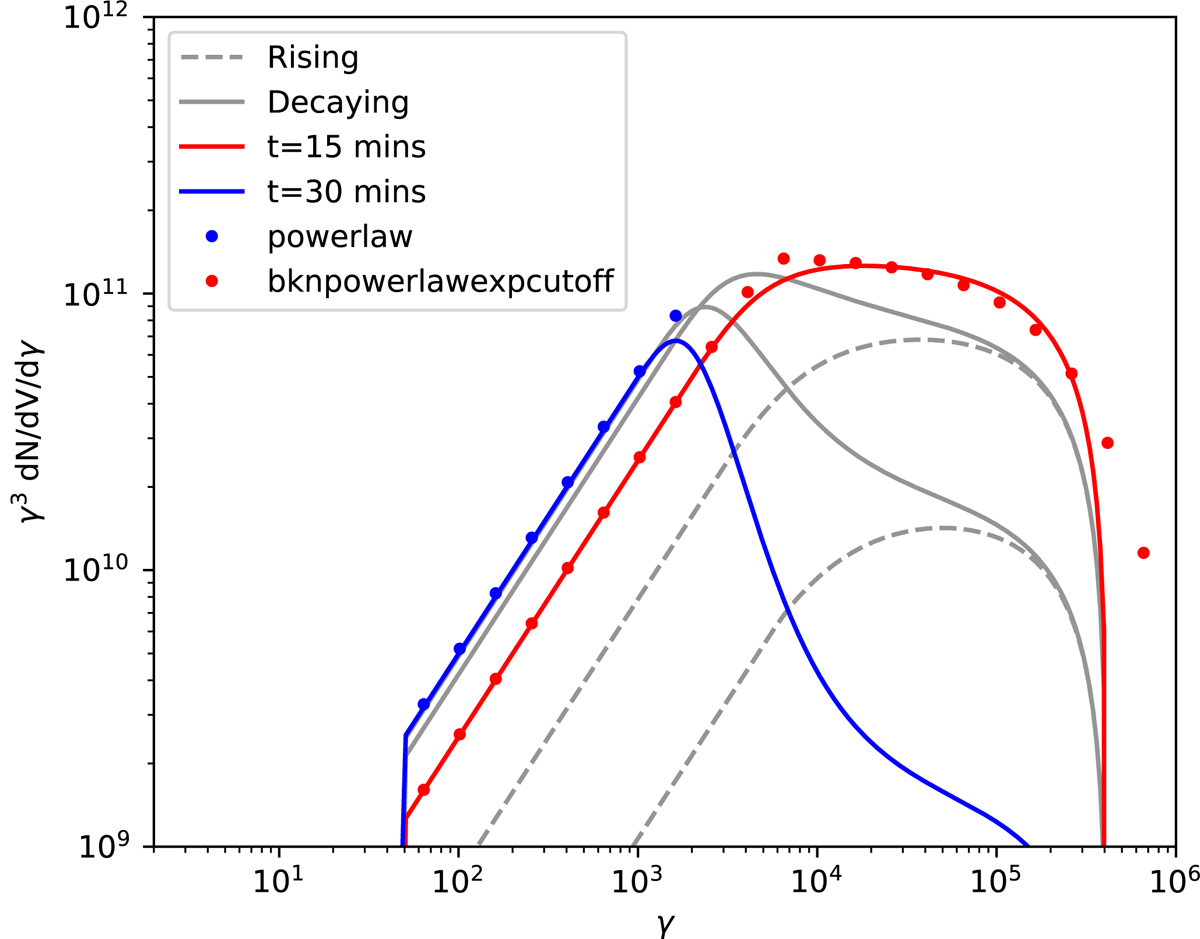
Fig. 5.
Download original image
Evolution of a power-law electron distribution under synchrotron cooling and Gaussian particle injection with parameters noted in the text. Time evolution of the electron distribution is presented as snapshots taken every 5 min. Grey dashed lines refer to the rising part of the evolution and solid lines to the decaying part. The red line represents the spectrum at the peak of injection profile (t = 15 min) whereas red dots are the approximation with a broken power-law distribution. The blue line is the electron distribution 15 min after injection peak (t = 30 min) and blue dots are the approximation with a simple power law.
Current usage metrics show cumulative count of Article Views (full-text article views including HTML views, PDF and ePub downloads, according to the available data) and Abstracts Views on Vision4Press platform.
Data correspond to usage on the plateform after 2015. The current usage metrics is available 48-96 hours after online publication and is updated daily on week days.
Initial download of the metrics may take a while.