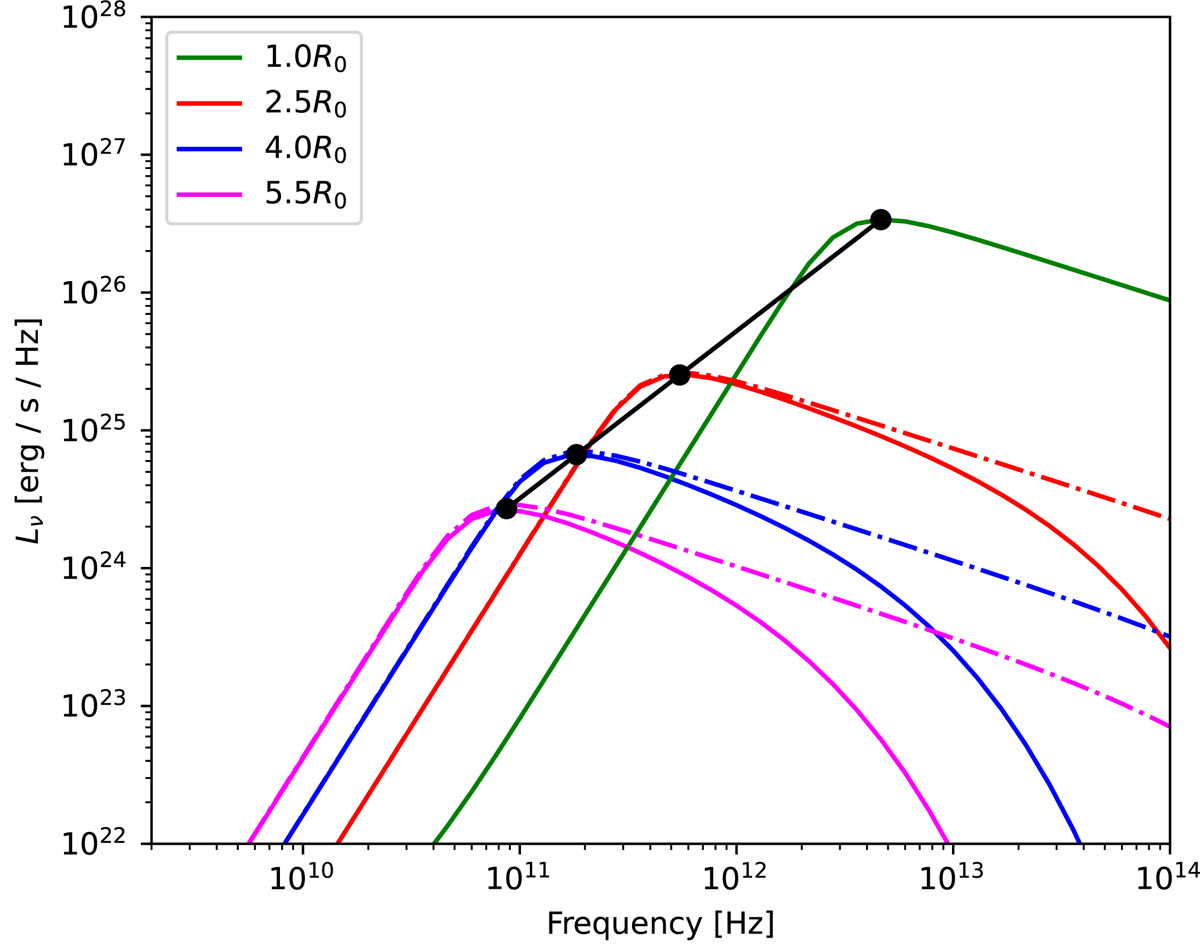
Fig. 4.
Download original image
Temporal evolution of synchrotron SEDs calculated at selected radii with the utility function discussed in Sect. 2.6. We refer to the text for further details. Coloured dashed lines refer to an evolution in which synchrotron cooling is assumed to be negligible, and this would be equivalent to the traditional van der Laan (1966) formalism. Solid lines represent the case in which synchrotron cooling is enabled. The black line is the expected evolution of the self-absorbed peak according to the van der Laan (1966) model.
Current usage metrics show cumulative count of Article Views (full-text article views including HTML views, PDF and ePub downloads, according to the available data) and Abstracts Views on Vision4Press platform.
Data correspond to usage on the plateform after 2015. The current usage metrics is available 48-96 hours after online publication and is updated daily on week days.
Initial download of the metrics may take a while.