Open Access
Fig. 2.
Download original image
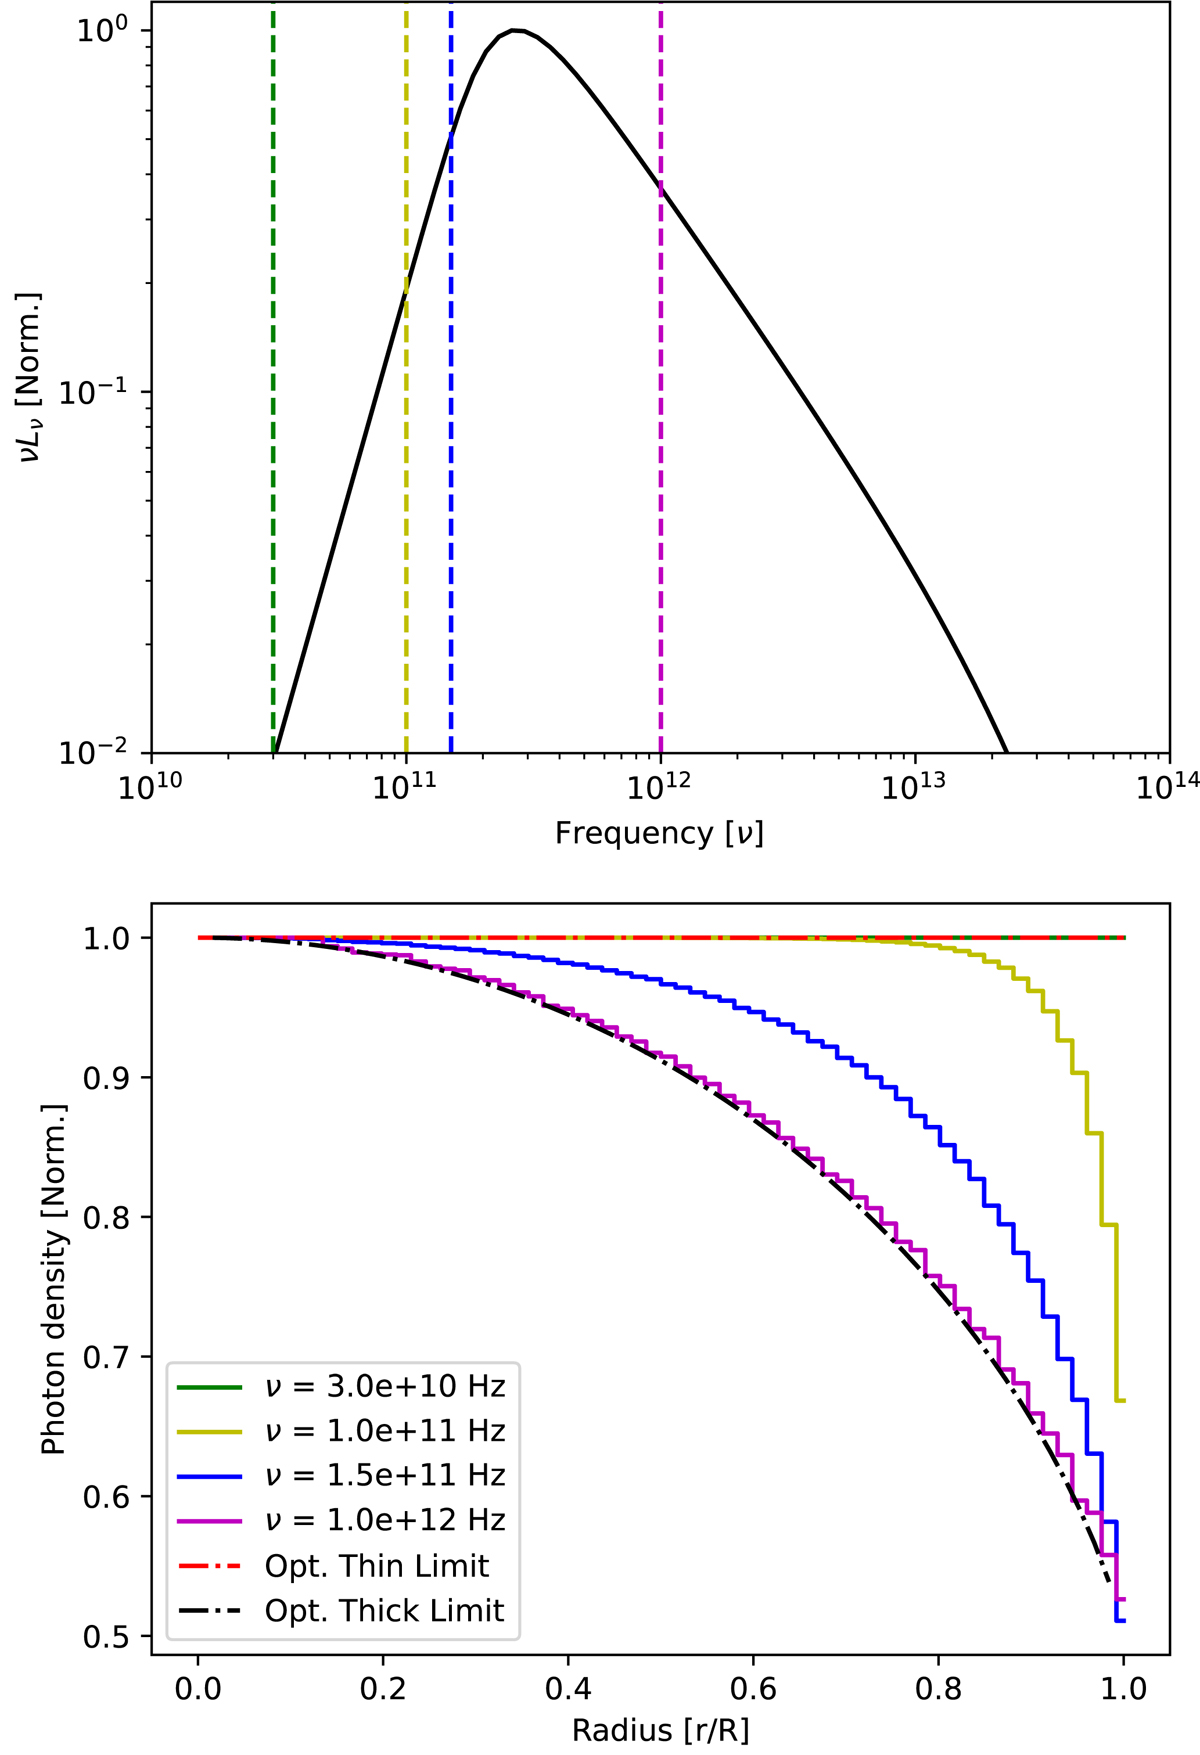
Top: representative synchrotron SED where vertical dashed lines are equivalent to the colour-coded frequencies in the bottom plot. Bottom: numerical solution to the photon densities in a homogeneous sphere at the selected frequencies. The optically thin and thick limits are shown with the two dot-dashed lines.
Current usage metrics show cumulative count of Article Views (full-text article views including HTML views, PDF and ePub downloads, according to the available data) and Abstracts Views on Vision4Press platform.
Data correspond to usage on the plateform after 2015. The current usage metrics is available 48-96 hours after online publication and is updated daily on week days.
Initial download of the metrics may take a while.