Fig. 1.
Download original image
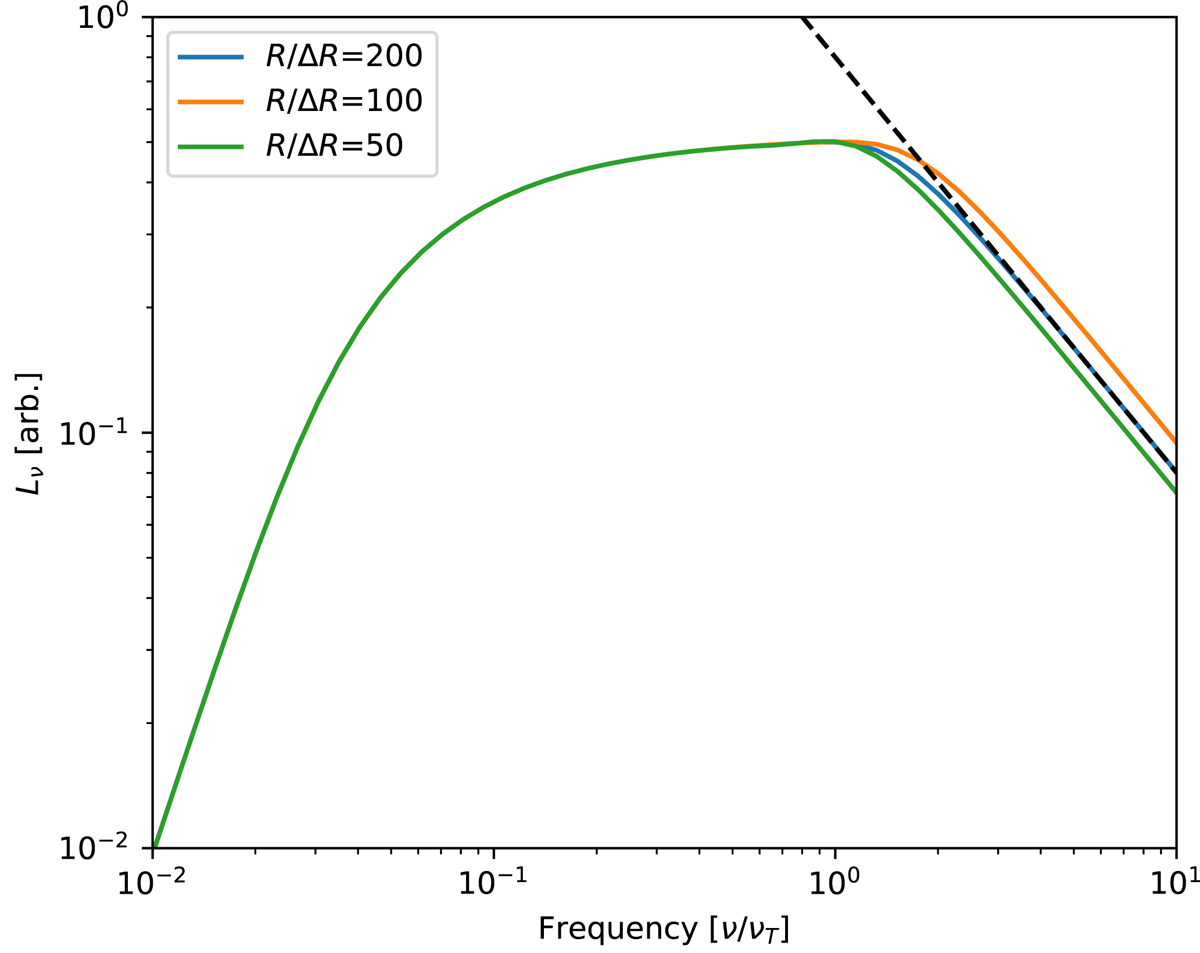
Synchrotron SED using our radial sphere implementation constructed with parameters m = 1, n = 2, x = 50 and α = 1 as formulated for a power-law sphere in Band & Grindlay (1985). SEDs plotted in different colours refer to calculations at selected radial resolutions (R/ΔR) – 50, 100, and 200 grid points in radius respectively for x, 2x, and 4x. The black dashed line is the analytical form of the expected optically thin emission in Eq. (22). νT is the numerical estimate of the frequency where the SED peaks.
Current usage metrics show cumulative count of Article Views (full-text article views including HTML views, PDF and ePub downloads, according to the available data) and Abstracts Views on Vision4Press platform.
Data correspond to usage on the plateform after 2015. The current usage metrics is available 48-96 hours after online publication and is updated daily on week days.
Initial download of the metrics may take a while.