Fig. 5.
Download original image
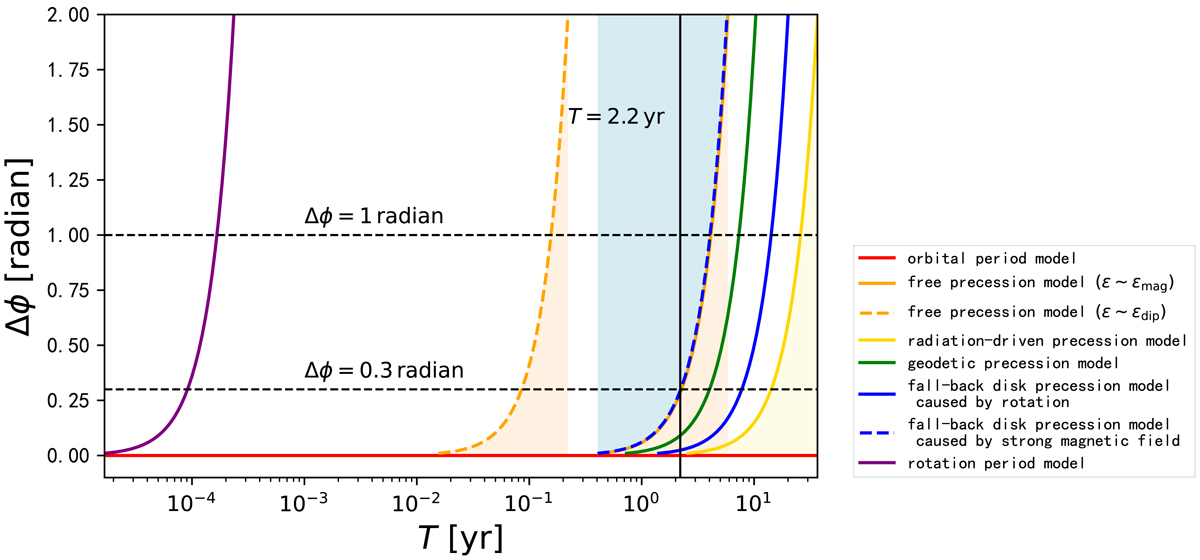
Relation between the phase shift Δϕ and the observation duration T for FRB 180916 by combining Eq. (1) with Eq. (2) in different models. The orange and yellow lines represent an upper limit and the blue dashed line represents a lower limit. The colored area can fit the observation. The solid vertical line shows T = 2.2 yr. The rotation period model does not fit the observation of |Δϕ|≲0.3 radian. The two dashed parallel lines mean Δϕ = 1 radian and Δϕ = 0.3 radian, respectively. These models can be tested by verifying whether or not there will be a detectable phase shift within a longer observation duration.
Current usage metrics show cumulative count of Article Views (full-text article views including HTML views, PDF and ePub downloads, according to the available data) and Abstracts Views on Vision4Press platform.
Data correspond to usage on the plateform after 2015. The current usage metrics is available 48-96 hours after online publication and is updated daily on week days.
Initial download of the metrics may take a while.