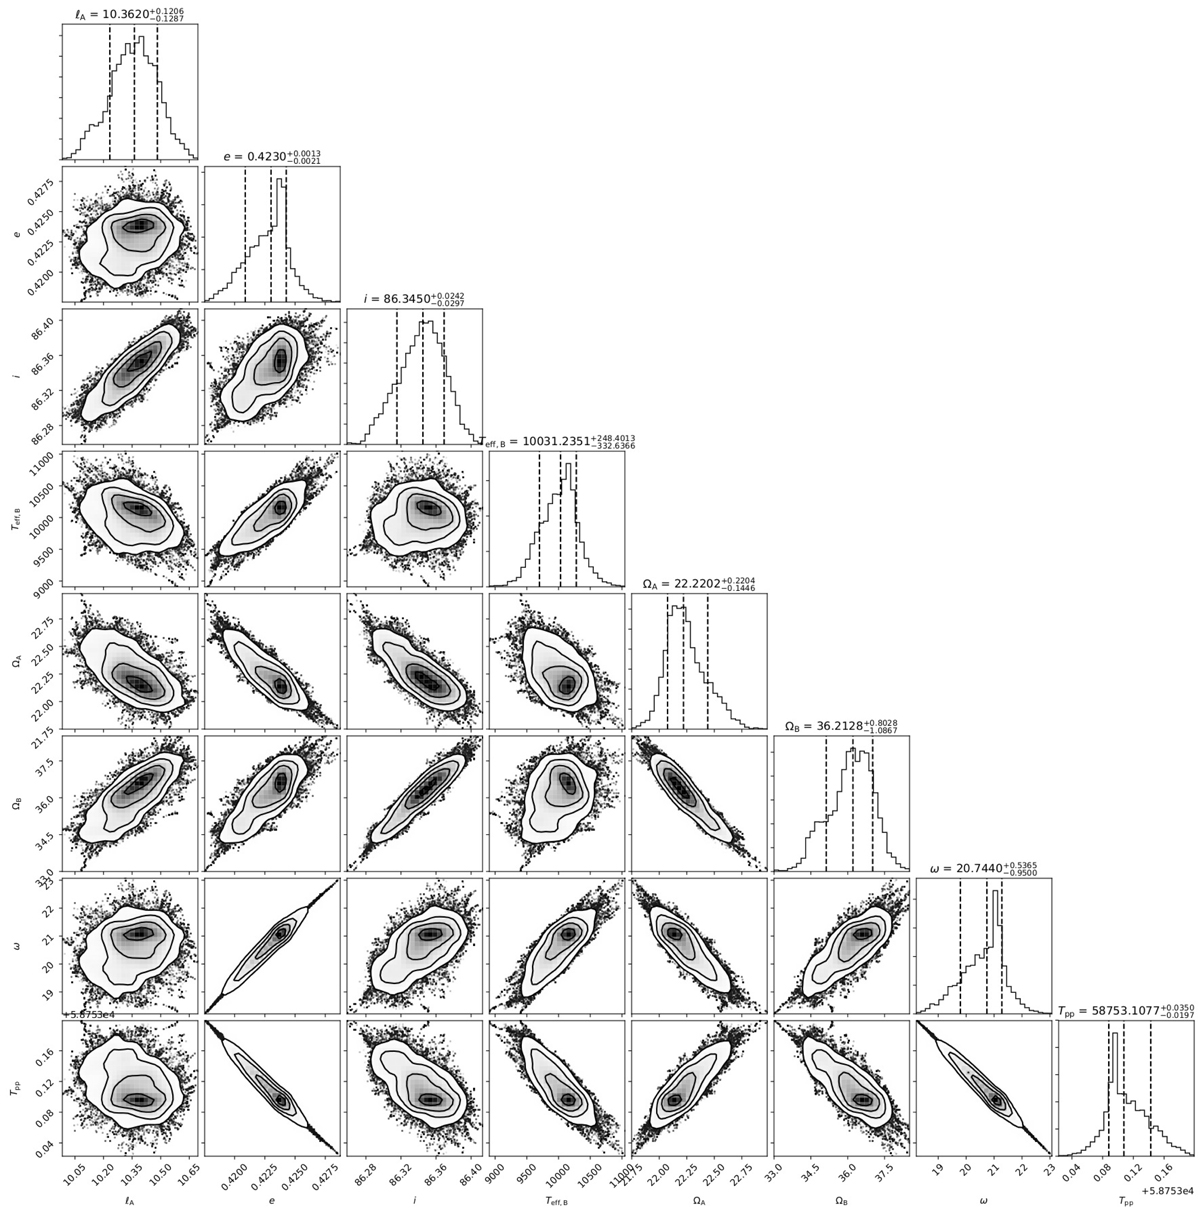
Fig. B.1.
Download original image
MCMC determination of the light curve parameters and accompanying uncertainties for TESS observations of α Dra in Part 1 (Sectors 14, 15, and 16). A strong correlation between parameters is present, as expected for partial (almost grazing) eclipses. The posterior distribution densities are plotted (solid contours). The histogram distributions (solid lines) are plotted across the associated quantity with 16th, 50th, and 84th percentiles levels (dashed lines).
Current usage metrics show cumulative count of Article Views (full-text article views including HTML views, PDF and ePub downloads, according to the available data) and Abstracts Views on Vision4Press platform.
Data correspond to usage on the plateform after 2015. The current usage metrics is available 48-96 hours after online publication and is updated daily on week days.
Initial download of the metrics may take a while.