Fig. 10.
Download original image
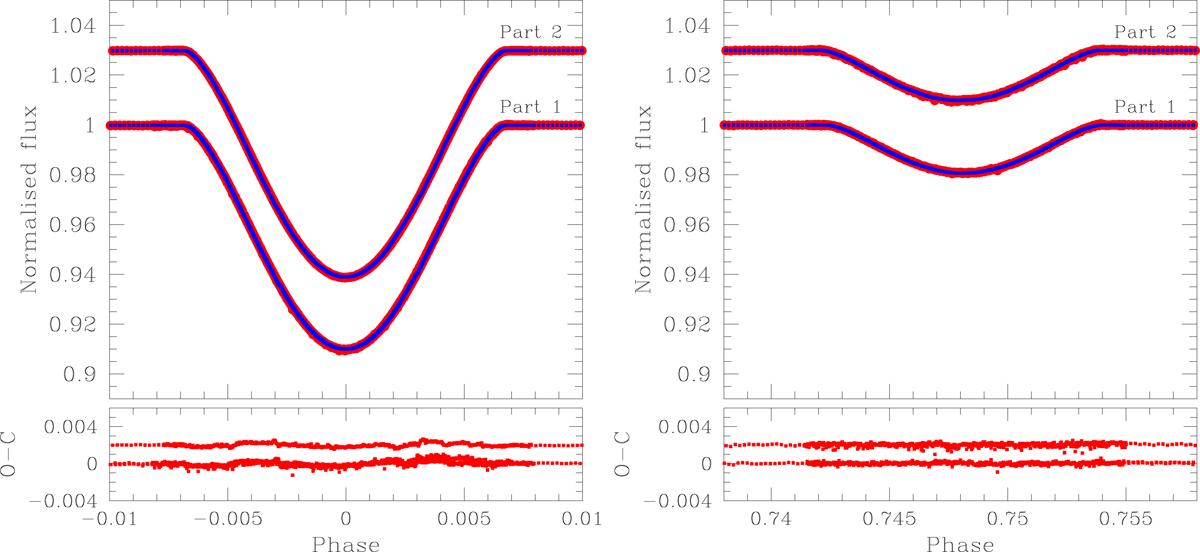
Fits to the TESS light curve of α Dra for the primary (left) and secondary (right) minima. The normalised TESS measurements (upper panels) and O-C residuals (lower panels) are shown as red symbols, while the best fit obtained with the WD code is illustrated as a blue solid line (see text for definition of Part 1 and Part 2 light curves). The phases are calculated from the ephemeris determined from the observed primary minima, Tpr. min = (2458696.01948 ± 0.00003)+(51.41891 ± 0.00011) E. The light curves and best fit, and the residuals, for Part 2 are arbitrarily shifted upwards for better visibility.
Current usage metrics show cumulative count of Article Views (full-text article views including HTML views, PDF and ePub downloads, according to the available data) and Abstracts Views on Vision4Press platform.
Data correspond to usage on the plateform after 2015. The current usage metrics is available 48-96 hours after online publication and is updated daily on week days.
Initial download of the metrics may take a while.