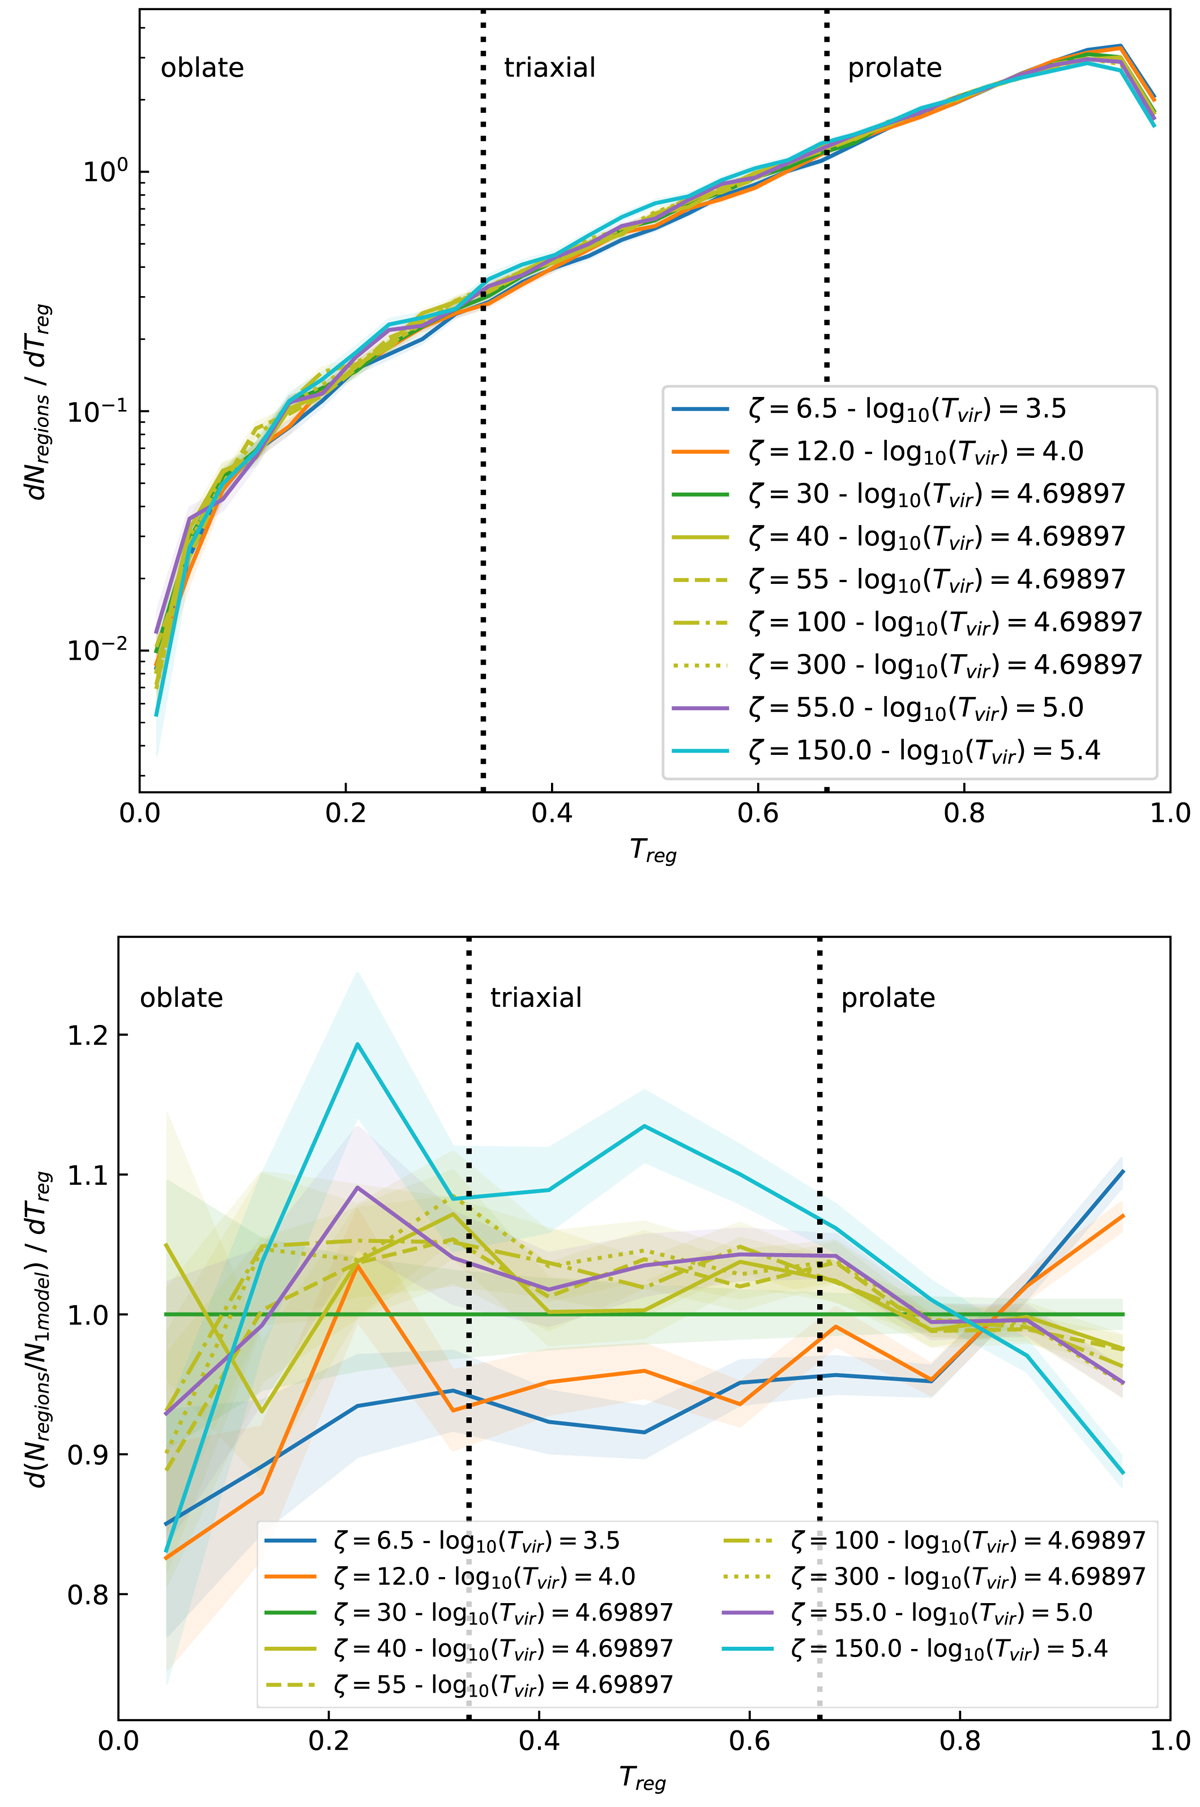
Fig. 7.
Download original image
Probability distribution functions of the triaxiality parameter of the reionisation patches of every model (top panel). Bottom panel: same PDFs, but each one of them is divided by one particular model (with ζ = 30 and log10(Tvir) = 4.69897). All the patches of each run for one specific model are accumulated in the two panels.
Current usage metrics show cumulative count of Article Views (full-text article views including HTML views, PDF and ePub downloads, according to the available data) and Abstracts Views on Vision4Press platform.
Data correspond to usage on the plateform after 2015. The current usage metrics is available 48-96 hours after online publication and is updated daily on week days.
Initial download of the metrics may take a while.