Open Access
Fig. 5.
Download original image
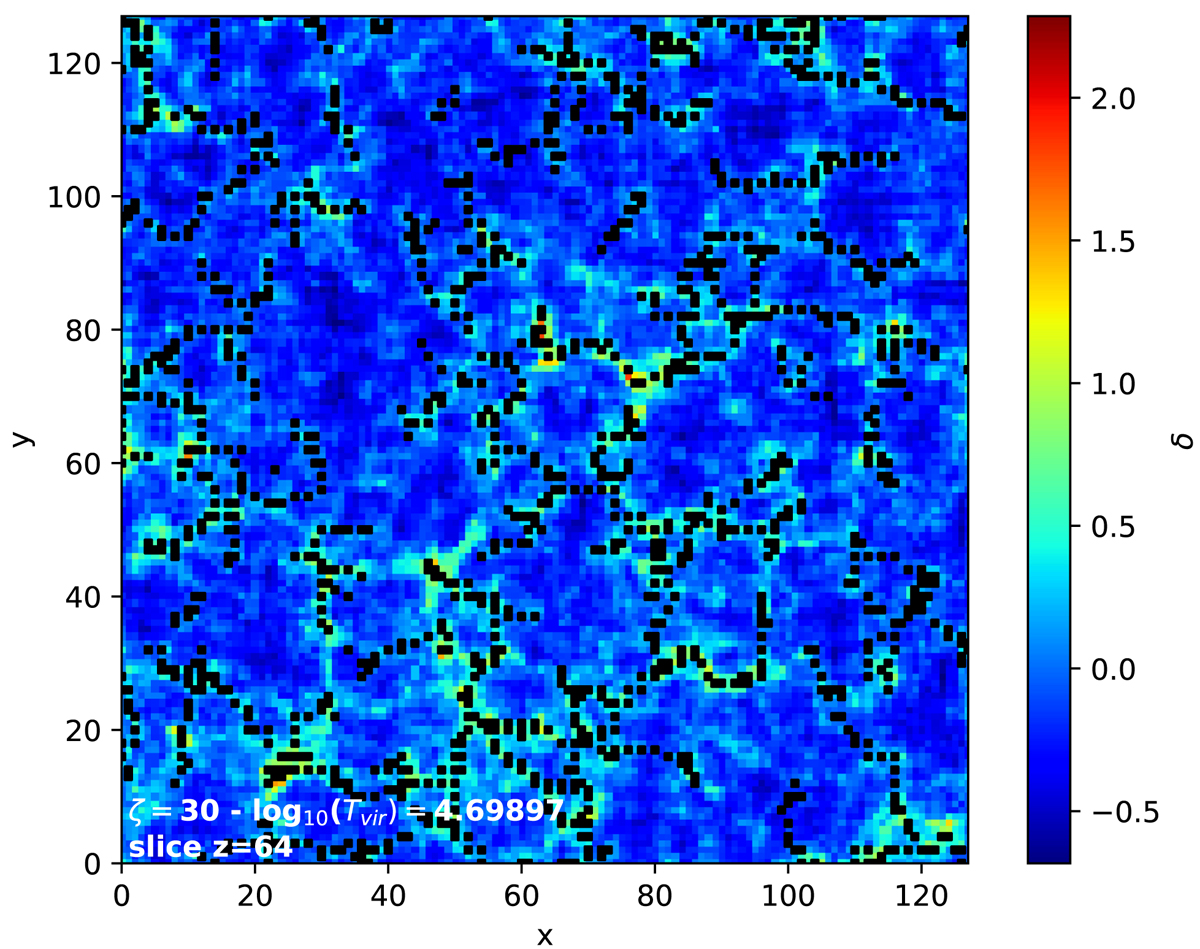
2D slice of the density field extracted from a 21cmFAST simulation (model ζ = 30 and Tvir = 5 × 10⁴ K). The density is superimposed on the filaments (in black) obtained with DisPerSE (with a persistence level of 0.5-σ). This map is made from an average of many slices to better visualise the filaments.
Current usage metrics show cumulative count of Article Views (full-text article views including HTML views, PDF and ePub downloads, according to the available data) and Abstracts Views on Vision4Press platform.
Data correspond to usage on the plateform after 2015. The current usage metrics is available 48-96 hours after online publication and is updated daily on week days.
Initial download of the metrics may take a while.