Fig. 20.
Download original image
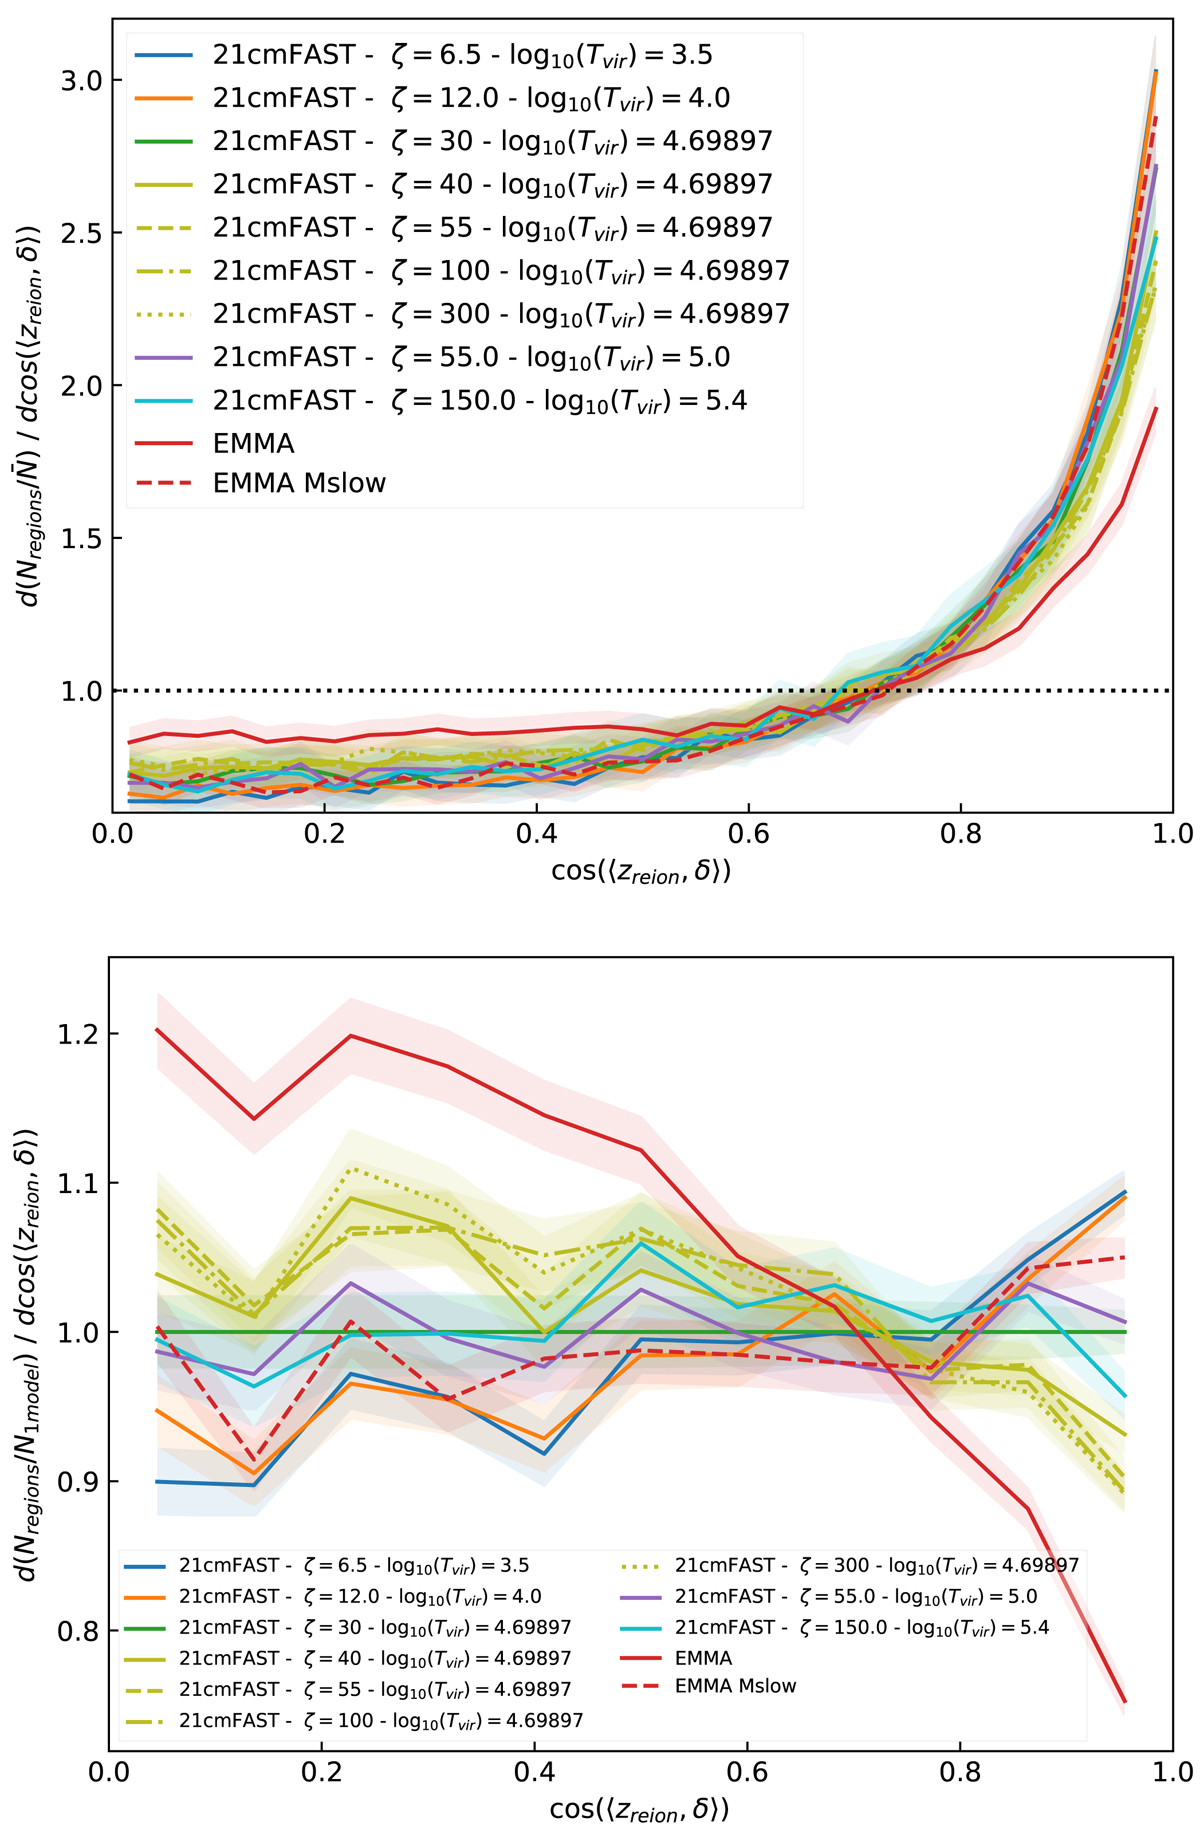
Probability distribution functions of the cosine of the angle between the reionisation patches and their corresponding filaments (top panel). Bottom panel: same PDFs, but divided by the one of the model with ζ = 30 and log10(Tvir) = 4.69897. Each 21cmFAST model is represented here, alongside with the two EMMA simulations, accumulating all patches of 64 runs in both panels.
Current usage metrics show cumulative count of Article Views (full-text article views including HTML views, PDF and ePub downloads, according to the available data) and Abstracts Views on Vision4Press platform.
Data correspond to usage on the plateform after 2015. The current usage metrics is available 48-96 hours after online publication and is updated daily on week days.
Initial download of the metrics may take a while.