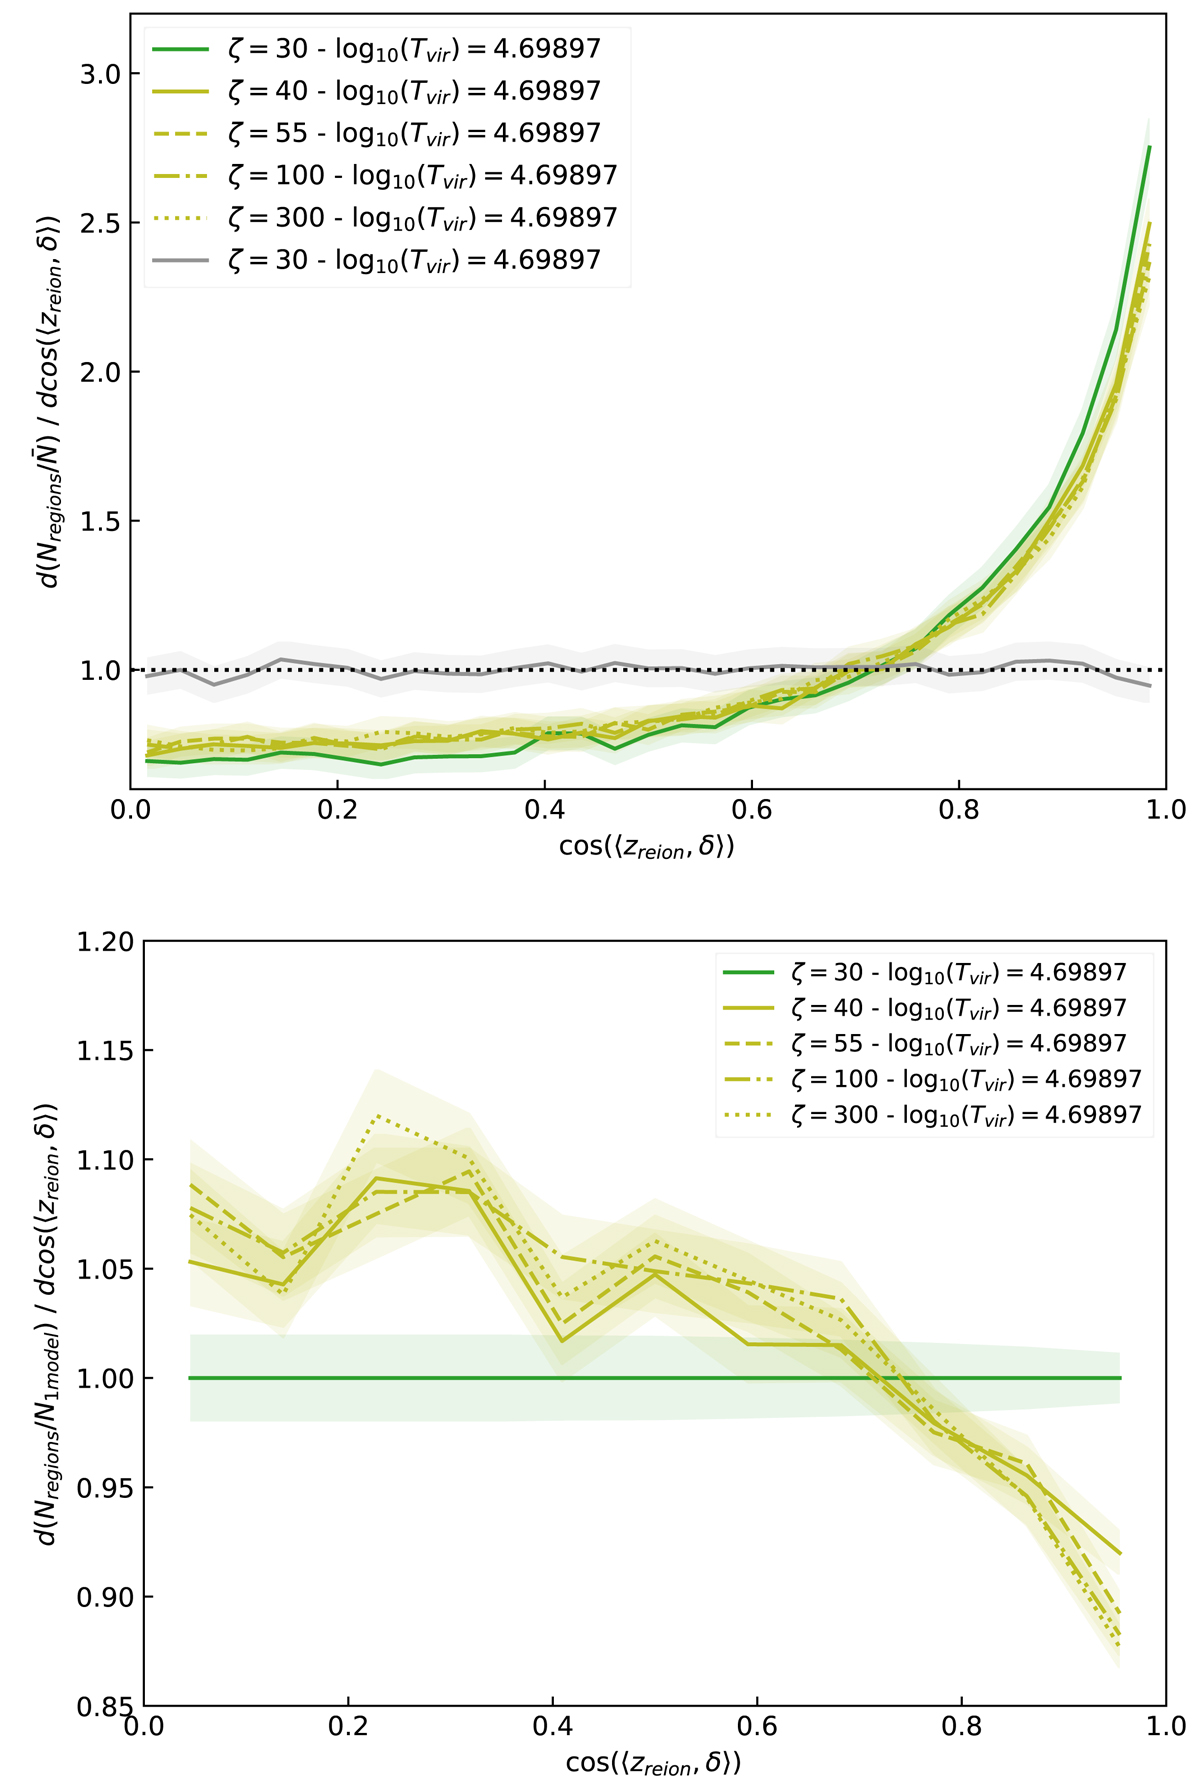
Fig. 12.
Download original image
Probability distribution functions of the cosine of the angle between the reionisation patches and their corresponding filaments (top panel). Bottom panel: same PDFs are shown, but they are divided by the one of the model with ζ = 30 and log10(Tvir) = 4.69897. Each of the models that only varied ζ is represented here, and all patches of their 101 runs are accumulated in both panels. The model with ζ = 30 and log10(Tvir) = 4.69897 is also represented (top panel, in grey) with a rotation of filaments for comparison with total randomness.
Current usage metrics show cumulative count of Article Views (full-text article views including HTML views, PDF and ePub downloads, according to the available data) and Abstracts Views on Vision4Press platform.
Data correspond to usage on the plateform after 2015. The current usage metrics is available 48-96 hours after online publication and is updated daily on week days.
Initial download of the metrics may take a while.