Fig. 11.
Download original image
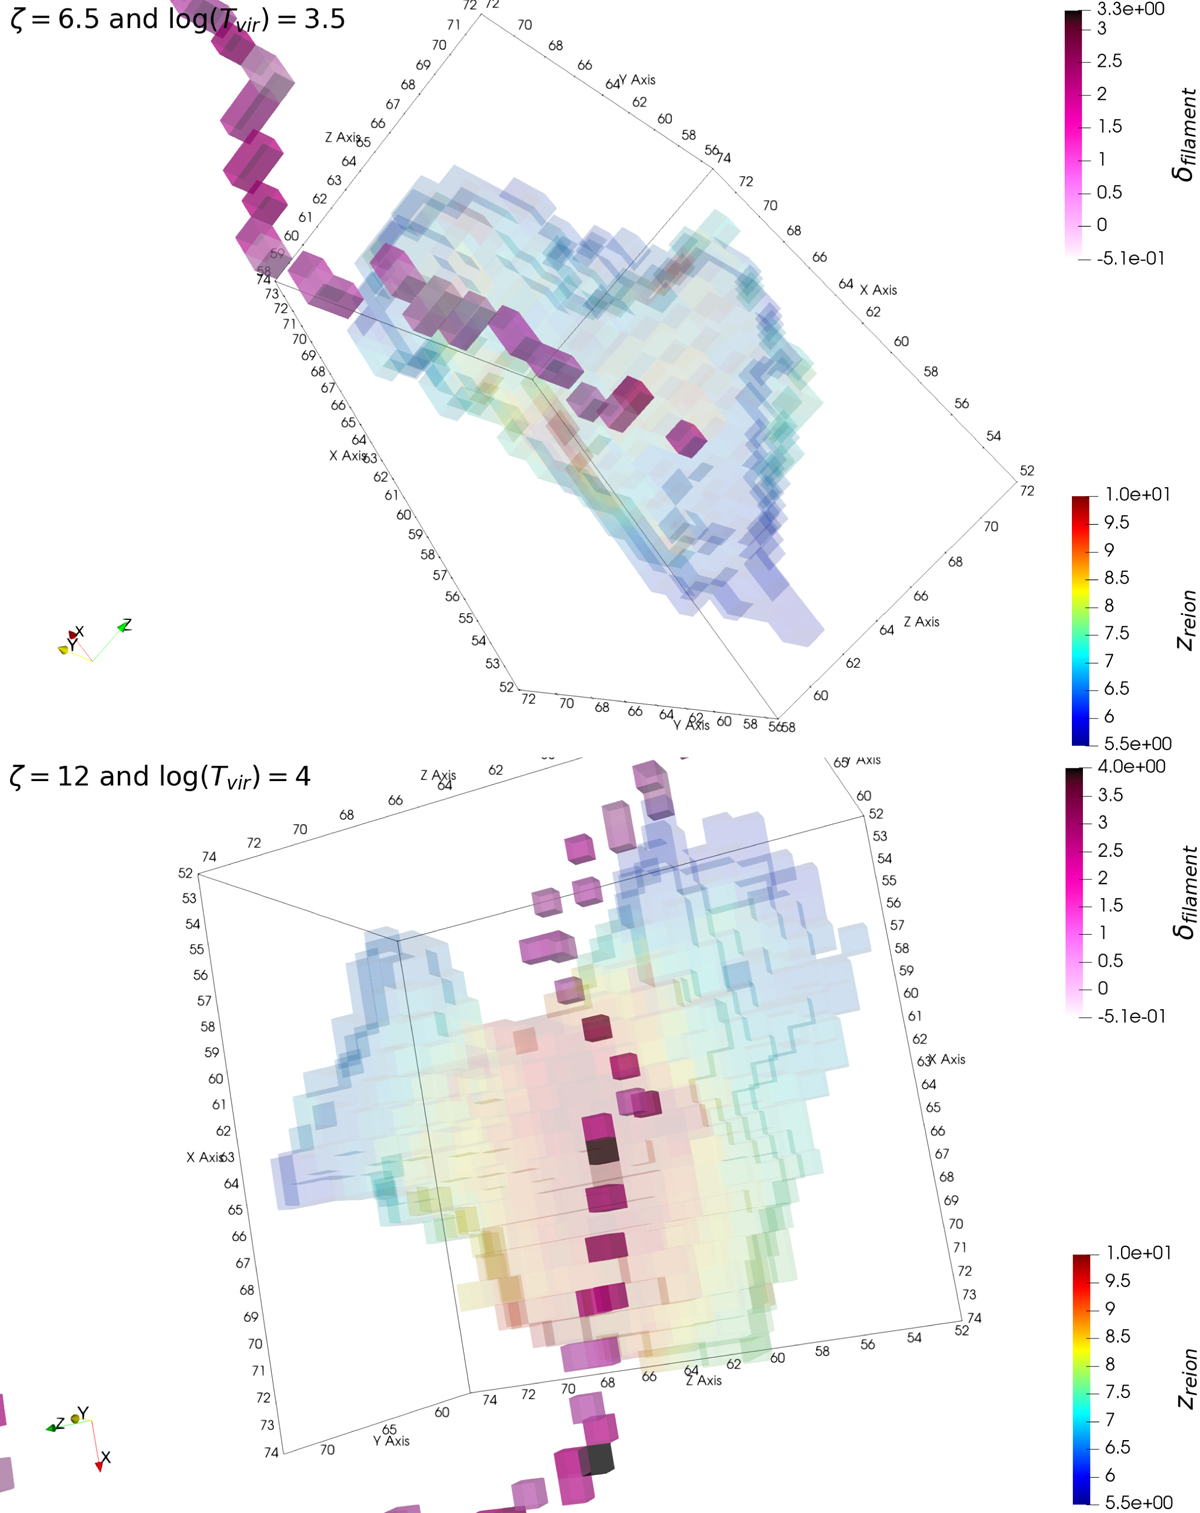
Examples of reionisation patches and their corresponding filament extracted from the segmentations of our simulations: the top panel shows a prolate-aligned region, and the bottom panel shows an oblate-perpendicular or butterfly region. In shades of pink, we show filaments, and rainbow colors indicate the zreion region. The redder the region, the earlier it reionised. In contrast, the bluer the region, the later it reionised.
Current usage metrics show cumulative count of Article Views (full-text article views including HTML views, PDF and ePub downloads, according to the available data) and Abstracts Views on Vision4Press platform.
Data correspond to usage on the plateform after 2015. The current usage metrics is available 48-96 hours after online publication and is updated daily on week days.
Initial download of the metrics may take a while.