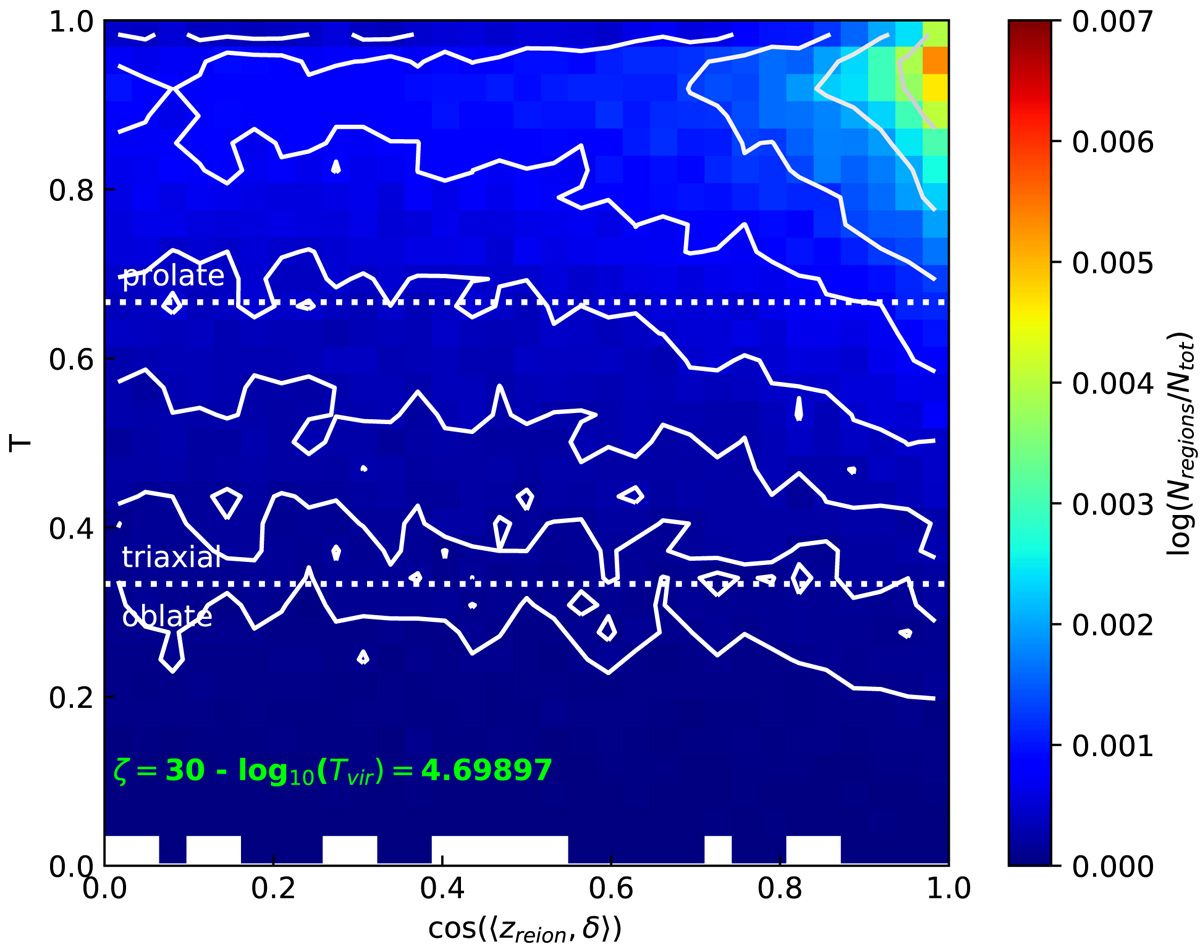
Fig. 10.
Download original image
2D histogram representing the logarithm of the ratio of the number of patches to the total number of patches of the simulation in bins of triaxiality parameter and cosine of the angle between reionisation patches and filaments for the fiducial model (with ζ = 30 and log10(Tvir) = 4.69897). The white full lines are the isocontours of the histogram. The coloured cells of this histogram correspond to non-zero values, and the white cells indicate zero values.
Current usage metrics show cumulative count of Article Views (full-text article views including HTML views, PDF and ePub downloads, according to the available data) and Abstracts Views on Vision4Press platform.
Data correspond to usage on the plateform after 2015. The current usage metrics is available 48-96 hours after online publication and is updated daily on week days.
Initial download of the metrics may take a while.