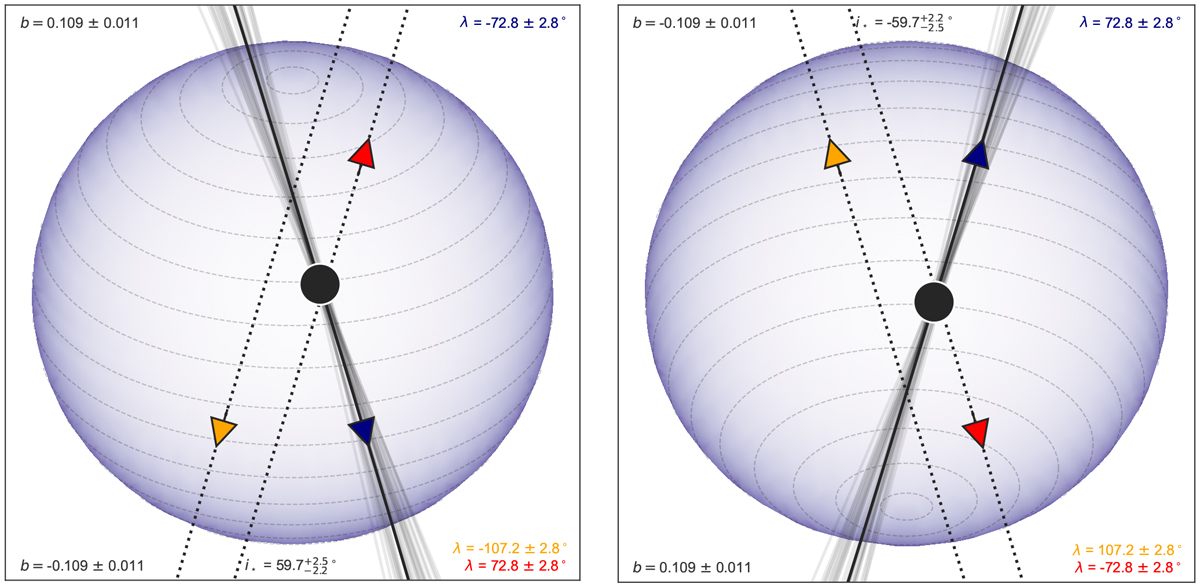
Fig. 6
Download original image
Visualisation of the path of the MASCARA-1 b transit across the stellar disk using the CHEOPS+Spitzer fit with priors from Doppler tomography. The star rotates anti-clockwise when viewed from the top, and the majority of the hemisphere in view moves from left to right. Constant stellar latitudes are marked with curved dashed lines. The colour scale is proportional to the flux emitted by the star, with brighter areas marked with lighter colours. For a given i⋆, all possible transit paths of the planet across the star can be described using different combinations of b and λ. The {b, λ} pair associated with the median path transited by the planet is shown with a solid black line with a blue arrow indicating the direction, and with 32 samples drawn from the posterior shown in grey. The dashed lines with red and orange arrows indicate alternative {b, λ} pairs that also describe the signals in the Doppler tomography and transit light curves, respectively. However, when considering the tomography and the transit light curve together, only the {b, λ} pair described by the blue arrow can successfully describe them both. Assuming stellar symmetry about the equatorial plane, there are two indistinguishable solutions for each arrow in the range − 90 <i⋆ < 90 deg: one with {b, i⋆, λ} and another with {−b, −i⋆, −λ}. The {b, λ} pairs with positive i⋆ (north pole pointing towards the observer) are shown in the left panel, and the {b, λ} pairs with negative i⋆ (north pole pointing away from the observer) are shown in the right panel. The blue arrow in the left panel is an example of a solution fitting the light curve with b > 0, and − 90 < λ < 90 deg, and corresponding solutions are found for all of the transit fits presented in this paper.
Current usage metrics show cumulative count of Article Views (full-text article views including HTML views, PDF and ePub downloads, according to the available data) and Abstracts Views on Vision4Press platform.
Data correspond to usage on the plateform after 2015. The current usage metrics is available 48-96 hours after online publication and is updated daily on week days.
Initial download of the metrics may take a while.