Fig. 5
Download original image
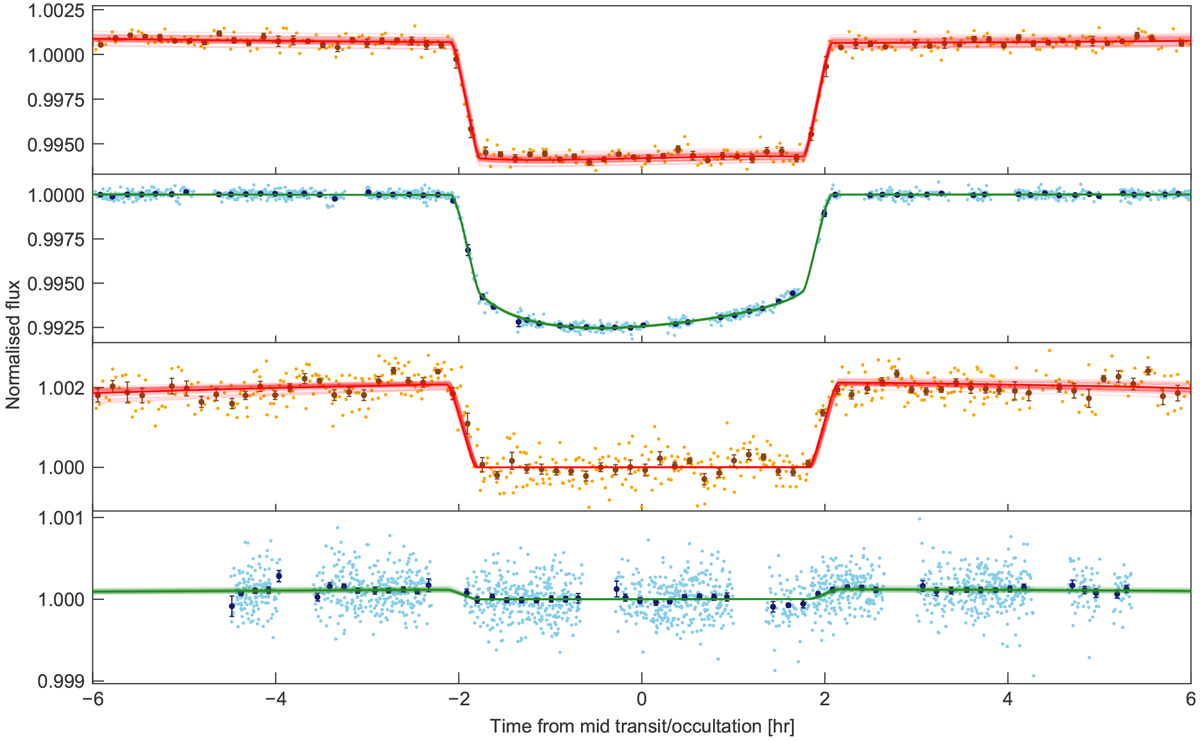
Phase-folded Spitzer and CHEOPS photometry centred on the transits and occultations, using the same format as the previouslight curves. Point with error bars show data in bins of 12 minutes. From top to bottom, the panels display the Spitzer transit, the CHEOPS transit, the Spitzer occultation, and the CHEOPS occultation, respectively.
Current usage metrics show cumulative count of Article Views (full-text article views including HTML views, PDF and ePub downloads, according to the available data) and Abstracts Views on Vision4Press platform.
Data correspond to usage on the plateform after 2015. The current usage metrics is available 48-96 hours after online publication and is updated daily on week days.
Initial download of the metrics may take a while.