Fig. 4
Download original image
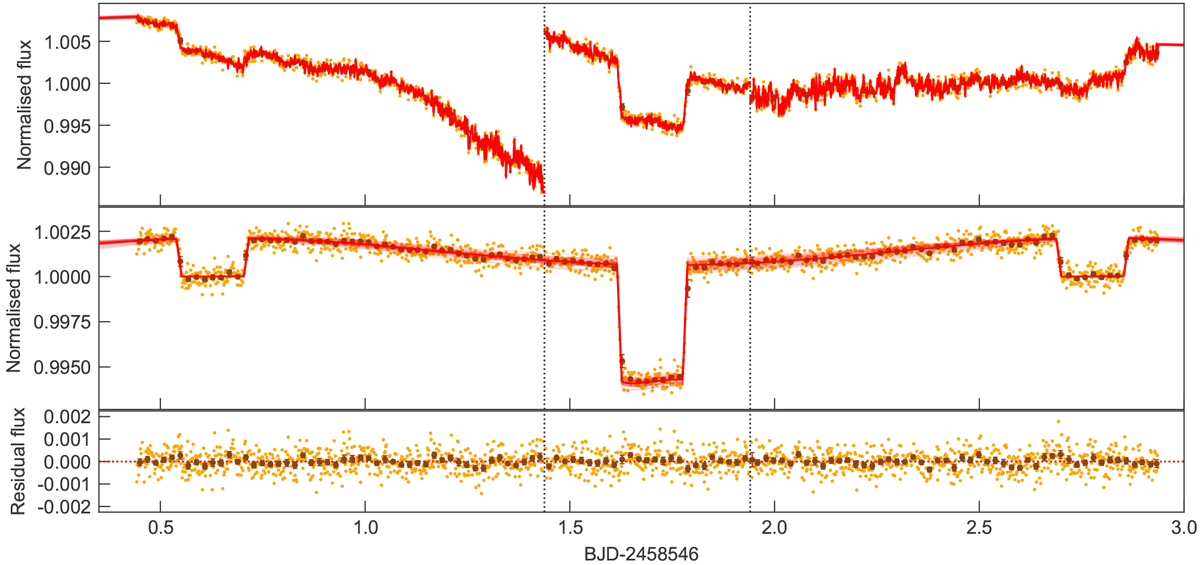
Normalised flux associated with the Spitzer phase curve observation. The raw data are shown in orange points, and data in bins of 30 min are shown in brown points with error bars. The best fitting model is shown with a red line, and the 32 models evenly spaced in the chain are shown in fainter red lines. The times when a new AOR begins are marked with dashed vertical lines. The top panel shows the raw flux, the middle panel shows the flux corrected for the instrumental effects with the transit, occultations and phase variations, and the bottom panel shows the residual flux. The mean absolute deviation of the residuals is 244 ppm.
Current usage metrics show cumulative count of Article Views (full-text article views including HTML views, PDF and ePub downloads, according to the available data) and Abstracts Views on Vision4Press platform.
Data correspond to usage on the plateform after 2015. The current usage metrics is available 48-96 hours after online publication and is updated daily on week days.
Initial download of the metrics may take a while.