Fig. 3
Download original image
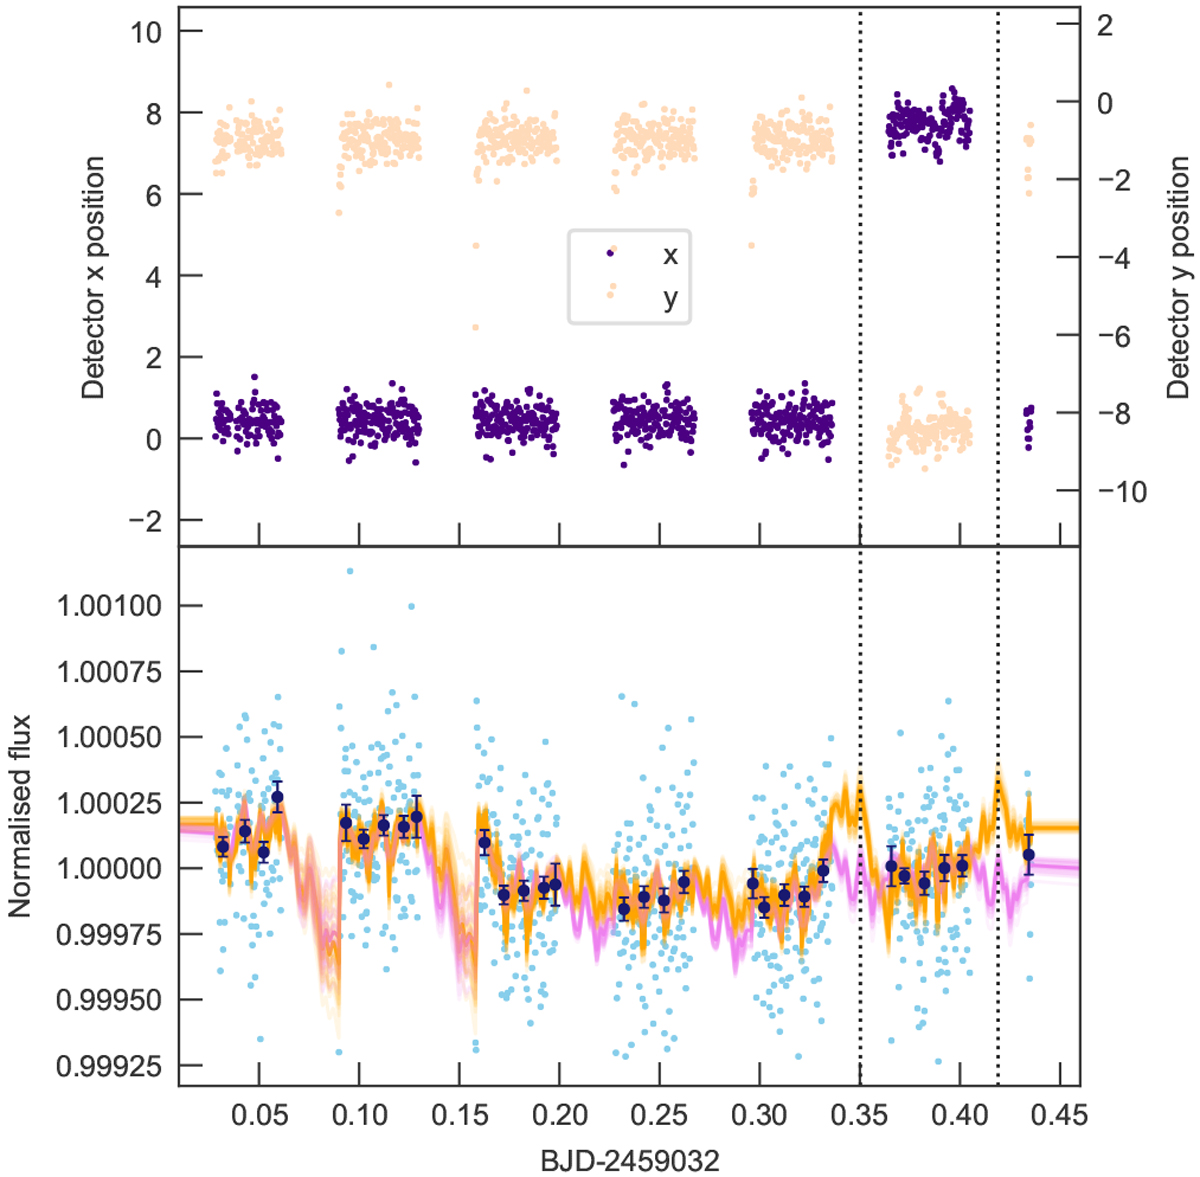
Top: x (indigo) and y (beige) positions of the PSF centroid on the detector. For the orbit that falls between the dotted lines, the PSF occupies a position roughly ten pixels away compared to the other orbits. Bottom: similar to the top panel of Fig. 2, but displaying the first CHEOPS occultation observation. The orange lines display models including y and y2 detector position in the baseline model. The violet lines display models instead including time in the baseline model.
Current usage metrics show cumulative count of Article Views (full-text article views including HTML views, PDF and ePub downloads, according to the available data) and Abstracts Views on Vision4Press platform.
Data correspond to usage on the plateform after 2015. The current usage metrics is available 48-96 hours after online publication and is updated daily on week days.
Initial download of the metrics may take a while.