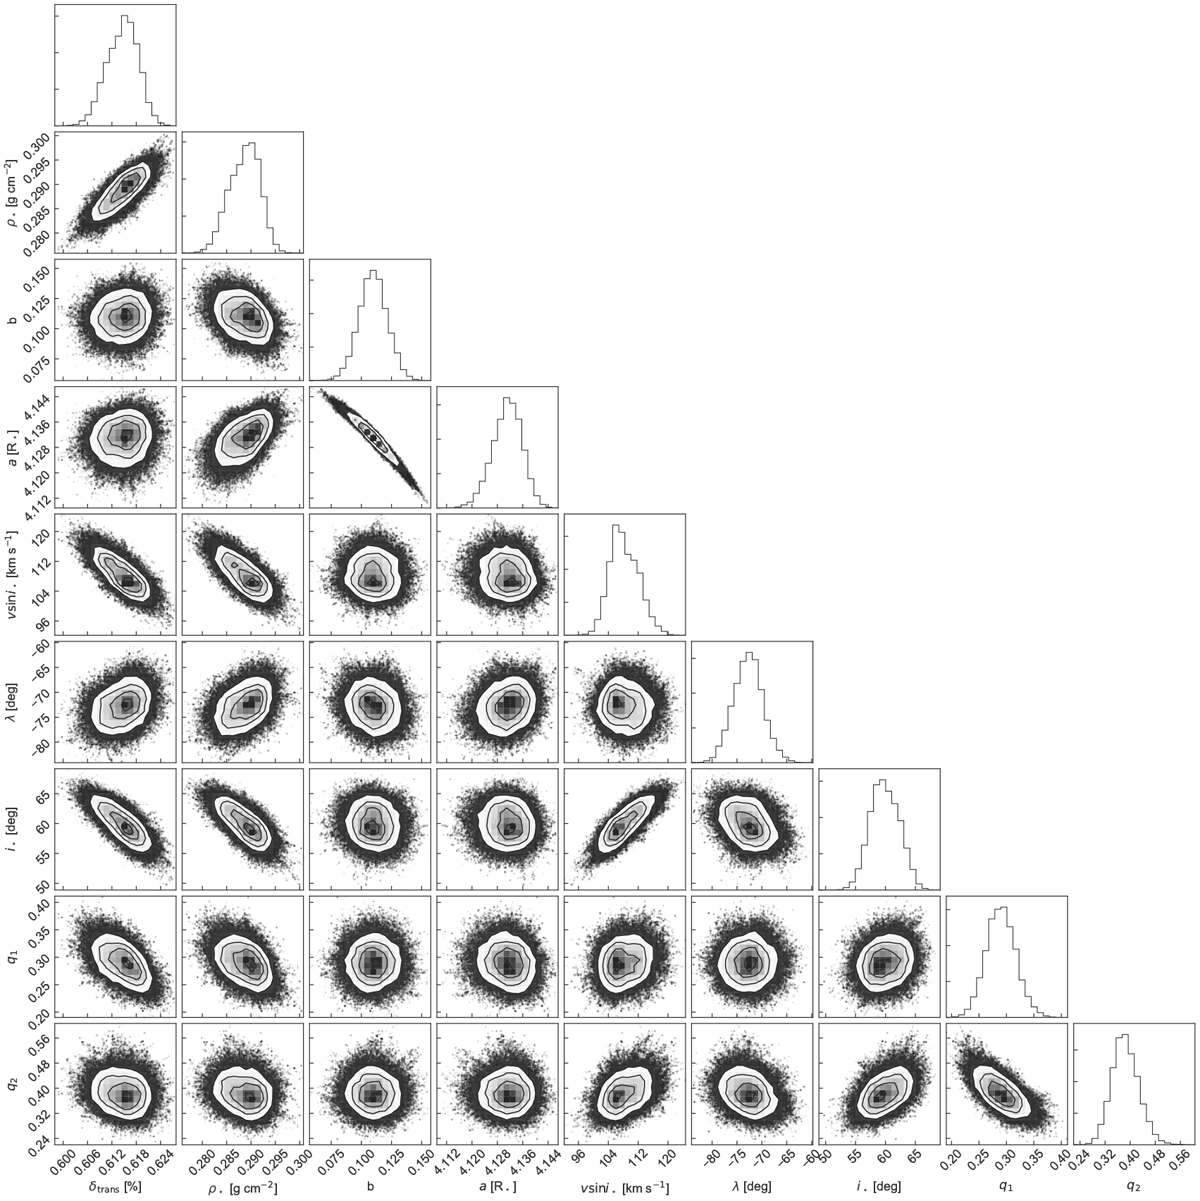
Fig. B.4
Download original image
Corner plot of the CHEOPS+Spitzer transit-only fit with the placement of Gaussian priors on b, v sin i⋆, and λ informed by the Doppler tomography. The strategy is described in full in Section 5 and the corresponding results are displayed in Table 3. This approach of using both the CHEOPS and Spitzer light curves and using priors from tomography is the one adopted for the fit to the full set of light curves presented in Section 7.
Current usage metrics show cumulative count of Article Views (full-text article views including HTML views, PDF and ePub downloads, according to the available data) and Abstracts Views on Vision4Press platform.
Data correspond to usage on the plateform after 2015. The current usage metrics is available 48-96 hours after online publication and is updated daily on week days.
Initial download of the metrics may take a while.