Fig. 11
Download original image
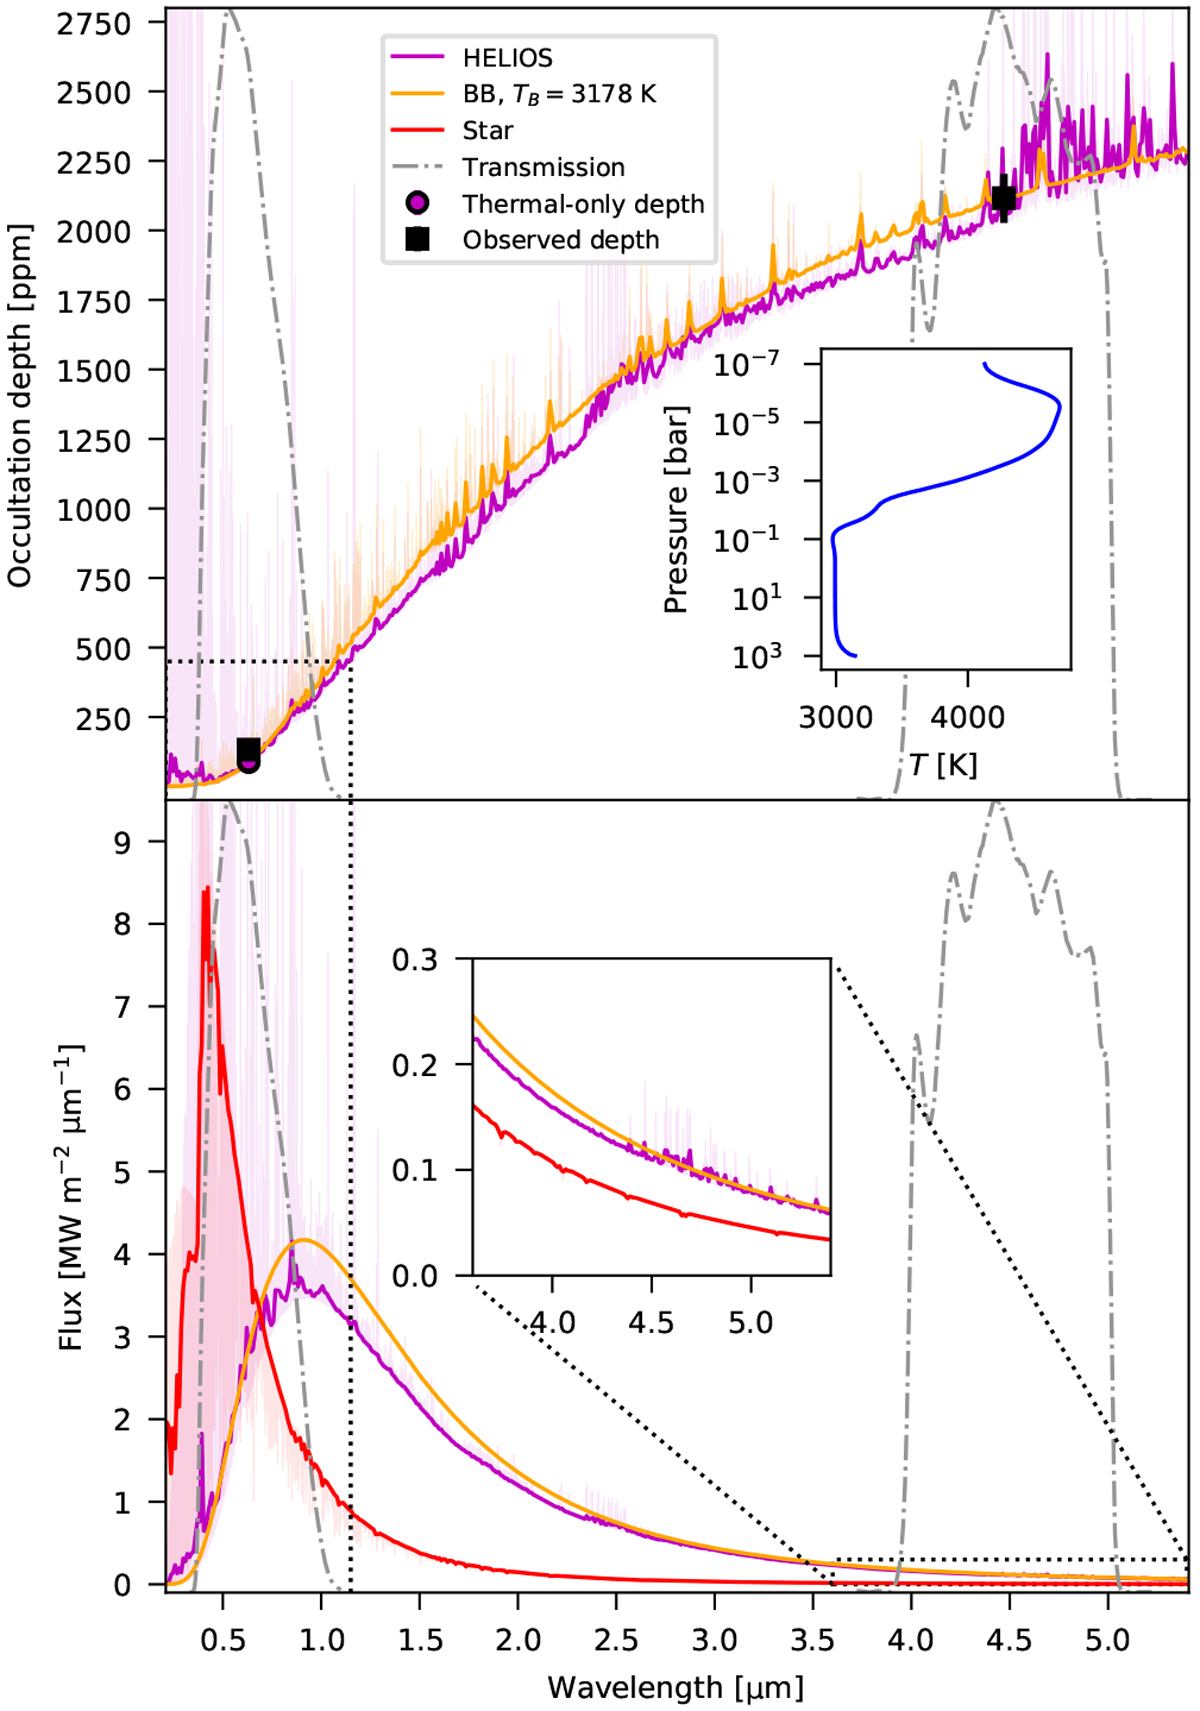
Top: emission spectra generated to fit the Spitzer occultation depth, as described in Sect. 7.4. The spectrum from the HELIOS grid is shown in magenta and the best fitting blackbody is shown in orange. The unbinned spectra are shown with thin, lighter lines. Binned spectra are also shown in darker, thicker lines for display purposes. The measured CHEOPS and Spitzer occultation depths are shown with black squares with error bars, and the implied depths according to the spectra are shown with coloured circles (obscured by the measured depth in the case of Spitzer). The CHEOPS and Spitzer response functions are shown in grey. Inset top: the temperature–pressure profile of the best fitting HELIOS spectrum. Bottom: the same spectra, but shown in terms of flux instead of occultation depth. The PHOENIX spectrum used for the star is shown in red, shrunk by a factor of 50 for display purposes. Right inset: a closer look at the flux at wavelengths covered by the Spitzer/IRAC 4.5 μm bandpass. Other dotted lines in both panels are regions that are displayed in Fig. 12.
Current usage metrics show cumulative count of Article Views (full-text article views including HTML views, PDF and ePub downloads, according to the available data) and Abstracts Views on Vision4Press platform.
Data correspond to usage on the plateform after 2015. The current usage metrics is available 48-96 hours after online publication and is updated daily on week days.
Initial download of the metrics may take a while.