Fig. 10
Download original image
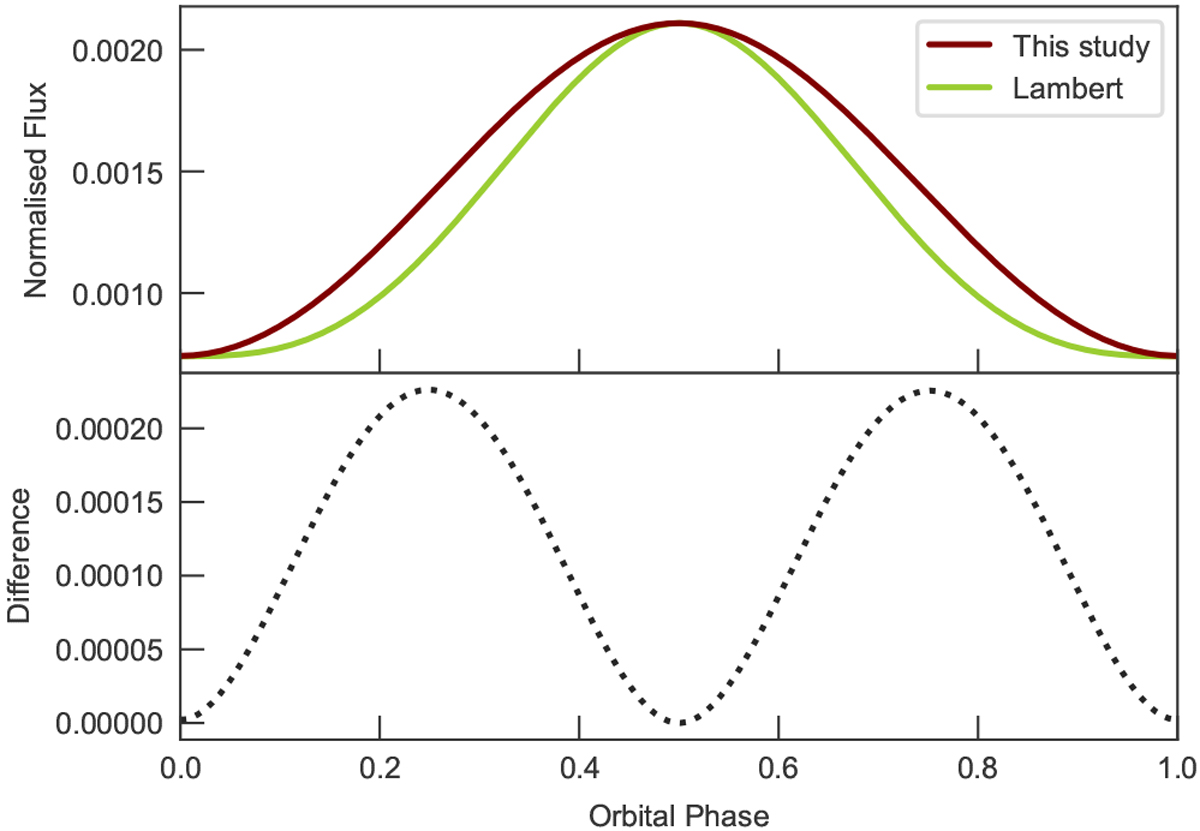
Top panel: phase curve model associated with the median result for the Spitzer bandpass (maroon), which is the sum of the thermal and reflected light components described in Sect. 4.2. A Lambertian phase curve model with the same amplitude, minimum flux, and hotspot offset (green) is also shown. Bottom panel: flux difference between the two models.
Current usage metrics show cumulative count of Article Views (full-text article views including HTML views, PDF and ePub downloads, according to the available data) and Abstracts Views on Vision4Press platform.
Data correspond to usage on the plateform after 2015. The current usage metrics is available 48-96 hours after online publication and is updated daily on week days.
Initial download of the metrics may take a while.