Fig. 1
Download original image
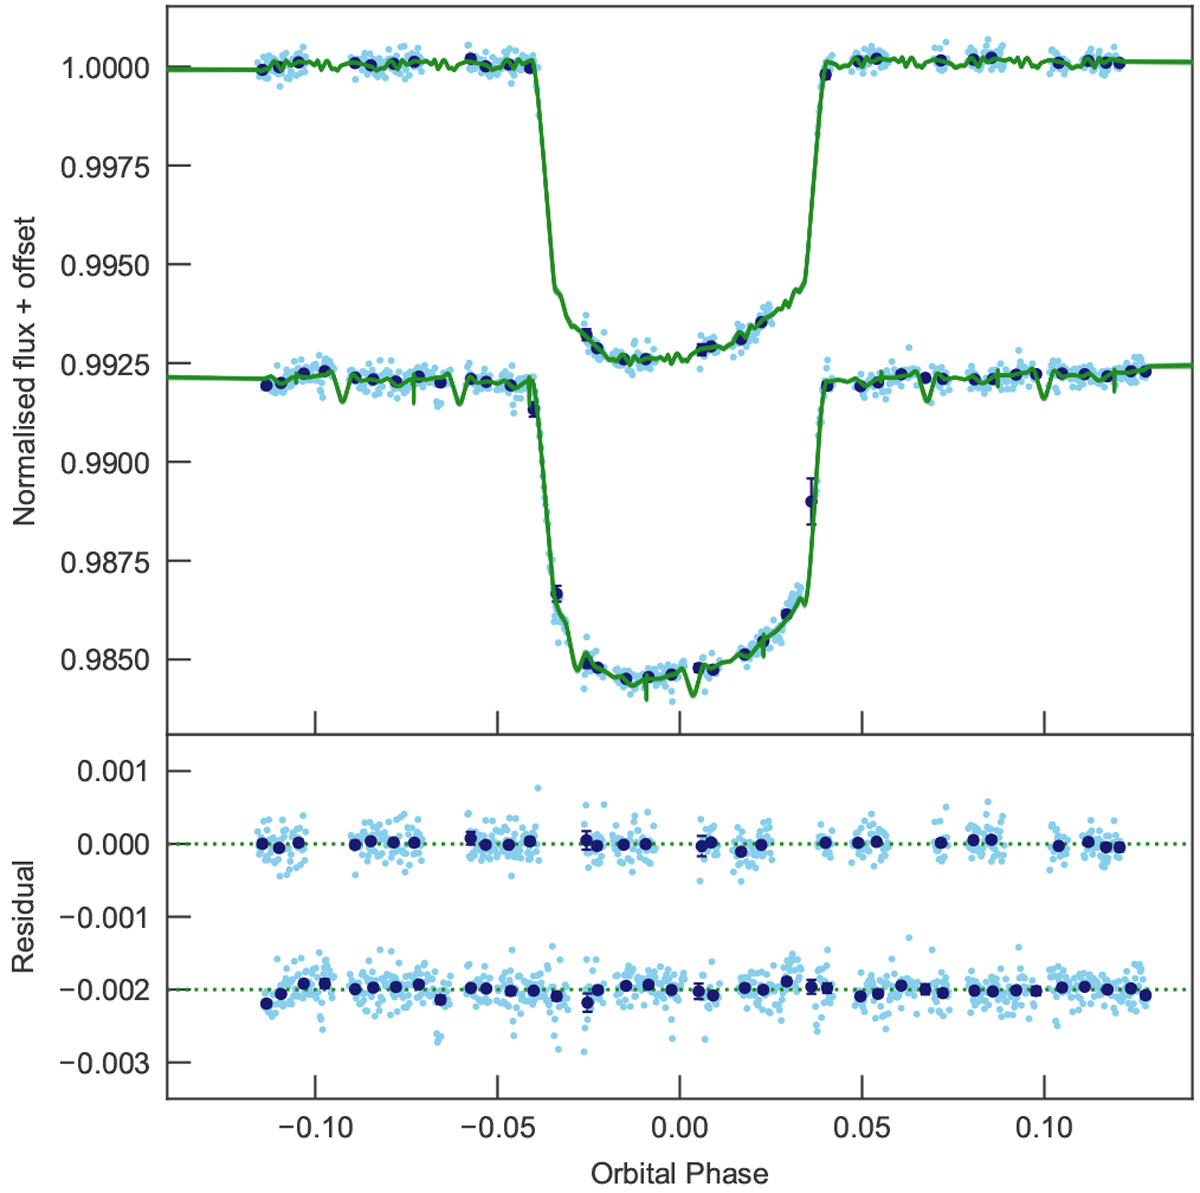
Normalised flux associated with the two CHEOPS transit observations as a function of orbital phase, with an arbitrary offset applied for display purposes. The raw data are shown in light blue points, and data in bins of 12 min are shown in dark blue points with error bars. The best fitting model is shown with a green line, and the 32 models evenly spaced in the chain are shown in fainter green lines. The top panel shows the raw flux, and the bottom panel shows the residual flux. The asymmetry visible in the transits is caused by stellar rotation-induced gravity darkening. The root mean square (RMS) of the residuals is 365 ppm.
Current usage metrics show cumulative count of Article Views (full-text article views including HTML views, PDF and ePub downloads, according to the available data) and Abstracts Views on Vision4Press platform.
Data correspond to usage on the plateform after 2015. The current usage metrics is available 48-96 hours after online publication and is updated daily on week days.
Initial download of the metrics may take a while.