| Issue |
A&A
Volume 658, February 2022
|
|
|---|---|---|
| Article Number | A148 | |
| Number of page(s) | 19 | |
| Section | Cosmology (including clusters of galaxies) | |
| DOI | https://doi.org/10.1051/0004-6361/202141644 | |
| Published online | 11 February 2022 | |
Relativistic corrections for measuring Hubble’s constant to 1% using stellar standard candles⋆
Institute of Physics, Laboratory of Astrophysics, École Polytechnique Fédérale de Lausanne (EPFL), Observatoire de Sauverny, 1290 Versoix, Switzerland
e-mail: This email address is being protected from spambots. You need JavaScript enabled to view it.
Received:
25
June
2021
Accepted:
8
November
2021
Abstract
We have estimated relativistic corrections for cosmic distance estimates based on stellar standard candles such as classical Cepheids and stars near the tip of the red giant branch (TRGB stars) with the goal of enabling a future unbiased 1% measurement of Hubble’s constant, H0. We considered four effects: K corrections, time dilation, the apparent change of host dust extinction due to non-comoving reference frames, and the change of observed color due to redshift. Using stellar model atmospheres, we computed extinction-dependent K corrections for a wide range of effective temperatures, between 3500 and 6000 K, iron abundances between [Fe/H] = −2.0 and 0.5, surface gravity between log g = 2.0 and 0.0, and host reddening (up to E(B − V)host = 0.5) for a range of redshifts corresponding to distances of ∼20−120 Mpc (z between 0.005 and 0.03) in several HST, JWST, and 2MASS filters. The optical-near-infrared (NIR) Wesenheit function applied by the Cepheid distance ladder is particularly useful for limiting the magnitude of K corrections and for mitigating complications arising from host dust extinction. Missing host extinction corrections related to the circumgalactic medium and circumstellar environments arising from stellar mass loss are discussed as potential systematics of TRGB distance measurements. However, their effect is estimated to be insufficient to explain differences in H0 values based on Cepheids or TRGB supernova calibrations. All stellar standard candle observations require relativistic corrections in order to achieve an unbiased 1% H0 measurement in the future. Applying the K correction, the redshift-Leavitt bias correction, and a correction for the Wesenheit slope redshift dependence, the Cepheid-based H0 measurement increases by 0.45 ± 0.05 km s−1 Mpc−1 to H0SH0ES = 73.65 ± 1.30 km s−1 Mpc−1, raising the tension with the early-Universe value reported by the Planck Collaboration from 4.2σ to 4.4σ. For TRGB-based H0 measurements, we estimate a ∼0.5% upward correction for the methodology employed by Freedman et al. (H0CCHP = 70.2 ± 1.7 km s−1 Mpc−1) and an even smaller −0.15% downward correction for the methodology employed by Anand et al. (H0EDD = 71.4 ± 1.8 km s−1 Mpc−1). The opposite sign of these corrections is related to different reddening systematics and reduces the difference between the studies by ∼0.46 km s−1 Mpc−1. The optical-NIR Wesenheit function is particularly attractive for accurate distance measurements because it advantageously combines measurements in filters where K corrections have opposite signs. The JWST/NIRCAM F277W filter is of particular interest for TRGB stars thanks to its insensitivity to (weak) host reddening and K corrections below the level of 1% at Coma cluster distances.
Key words: distance scale / stars: variables: Cepheids / stars: distances / relativistic processes / methods: observational / dust, extinction
Full Tables A.1–A.3 are only available at the CDS via anonymous ftp to cdsarc.u-strasbg.fr (130.79.128.5) or via http://cdsarc.u-strasbg.fr/viz-bin/cat/J/A+A/658/A148
© ESO 2022
1. Introduction
Hubble’s constant, H0, which quantifies the present-day expansion rate of the Universe, is intimately linked to the size and age of the Universe and therefore a fundamental quantity for cosmology. A high-accuracy prior of H0 is required for constraining the equation of state of dark energy and for providing an absolute scale to many astrophysical and cosmological inquiries (e.g., Suyu et al. 2012; Weinberg et al. 2013). More recently, H0 has been hotly debated in terms of a tension between values of H0 derived from observations of the present-day Universe (e.g., Riess et al. 2016) and cosmology-dependent inferences based on early-Universe observations, such as the cosmic microwave background (CMB; Planck Collaboration VI 2020; cf. Verde et al. 2019; Di Valentino et al. 2021 for reviews). As argued by Riess (2020), the two types of H0 determinations provide a cosmological end-to-end test: any significant discrepancy between the observations of the early and present-day Universe would either indicate measurement error or incompleteness of the Λ cold dark matter model used to interpret early-Universe phenomena, such as the CMB power spectrum, the cosmological sound horizon, or Big Bang nucleosynthesis.
Type-Ia supernovae (SNeIa) play a particularly important role for measuring H0 in the present-day Universe thanks to the great precision they afford in mapping relative distances along the Hubble flow at distances insensitive to cosmology. However, as relative distance indicators, SNeIa require absolute calibration provided by distance ladders composed of stellar standard candles (SSCs), such as classical Cepheid variable stars (henceforth: Cepheids) or stars near the tip of the red giant branch (henceforth: TRGB stars) and SNeIa. Such distance ladders allow a purely empirical measurement of H0 tied to an absolute scale set by geometric or trigonometric measurements. The most precise distance-ladder-based H0 measurements now feature relative uncertainties of σH0/H0 ≈ 2% or better (e.g., Riess et al. 2021a; Freedman 2021; Anand et al. 2021a).
However, debate has ensued over the accuracy of the various SNIa luminosity zero-point calibrations (e.g., Efstathiou 2020), sparking significant efforts to quantify and mitigate any intervening systematics related to parallax accuracy (Riess et al. 2018, 2021a; Breuval et al. 2020; Groenewegen 2021), employed photometric techniques (Javanmardi et al. 2021; Anand et al. 2021a), reddening (e.g., Freedman et al. 2020; Górski et al. 2020; Hoyt 2021; Skowron et al. 2021; Soltis et al. 2021; Mortsell et al. 2021), source blending (Anderson & Riess 2018; Riess et al. 2020), and chemical composition (Gieren et al. 2018; Breuval et al. 2021), among others. Anderson (2019) recently showed that redshift-Leavitt bias (RLB) due to time dilation currently leads to a 0.3% H0 bias of H0 measurements based on the combined Cepheid and SNIa distance ladder. This bias grows beyond 1% when seeking to measure more distant Cepheids and Mira stars, for example, using the soon-to-be-launched James Webb Space Telescope (JWST). Since RLB leads to systematic underestimates of H0, the true value of H0 requires upward correction to higher values that tend to be more discrepant with Planck.
Among key systematics of SNeIa are the so-called K corrections initially proposed by Hubble (1936) that translate between the emitted and observed spectral energy distributions (SEDs). The K correction in its modern form was first presented by Humason et al. (1956), who credited Merle F. Walker with having independently arrived at a similar result in the same form in 1948. Further historical information on the development of the K correction is found in Sandage et al. (1995). Oke & Sandage (1968), Hamuy et al. (1993), and Kim et al. (1996) refined K corrections for application to SNeIa, and Hogg et al. (2002) presented an updated and didactic description, which supersedes previous discussions thanks to clear definitions and improved consistency. Nugent et al. (2002) considered the effect of K corrections and extinction effects on supernova (SN) light curves, albeit without incorporating reddening into the computation of K.
McCall (2004) investigated the redshift dependence of extinction corrections for redshifts far beyond the Hubble flow (z = 0.4). McCall further developed a methodology for correcting extinction incurred both in the emitter and the observer frame, pointing out the dependence of total-to-selective extinction on redshift. McCall (2004) also presented the first application of K corrections to Cepheid distances that sought to elucidate differences among distance measurements reported for NGC 4258 and different regions of M 31. McCall’s main focus, however, was the interplay between localized (emitter-frame) and foreground (Milky Way) extinction and how redshift changes the total-to-selective extinction required to correct distance measurements. Specifically, they discussed neither the impact of K corrections on the calibration of the SNIa luminosity zero point nor on the measurement of H0.
Relativistic effects bias H0 measurements because the expanding Universe increasingly separates the observer (z = (λ − λ0)/λ0 ≈ 0) and emitter inertial frames (SSCs in SN-host galaxies, z > 0) as a function of distance. Until a few years ago, the H0 measurements were not sufficiently precise for this effect to be relevant, so the assumption of comoving SSC calibration and application inertial frames was acceptable. However, the aim of achieving a 1% H0 measurement to understand the origins and implications of the Hubble tension requires reassessment of systematic effects previously considered insignificant, including the assumption of comoving reference frames. Since redshift increases linearly with distance (at low z), there should exist a threshold distance beyond which relativistic effects cannot be ignored in the pursuit of a 1% measurement. This is particularly true for the distance ladder for two principal reasons. Firstly, the calibration of SSCs is performed in the very nearby Universe, including, notably, the Milky Way (e.g., Cerny et al. 2020; Riess et al. 2021a), the Large and Small Magellanic Clouds (LMC and SMC, respectively; Riess et al. 2019; Hoyt 2021), and/or the megamaser galaxy NGC 4258 (Reid et al. 2019; Jang et al. 2021; Anand et al. 2021a), whereas SSCs are applied to determine the distance to galaxies that host SNe whose redshift relative to the calibration inertial frame is significantly nonzero (e.g., Riess et al. 2016; Freedman et al. 2019). Secondly, the greatest gains for H0 precision are anticipated by increasing the number of SN-host galaxies (e.g., Riess et al. 2021a), which implies observing SSCs at greater distances because the SNIa rate is volume-limited. Hence, the most promising efforts underway to improve H0 precision increase the sensitivity of H0 measurements to relativistic effects. To understand and mitigate any related biases that could occur in this endeavor, we here investigate the impact of relativistic effects, specifically K corrections and RLB as well as host dust extinction, on SSCs in SN-host galaxies. In so doing, we aim to formulate simple mitigation strategies both for previously reported measurements and the next-generation distance ladder to be constructed using JWST.
This article is structured as follows. Section 2 presents the extinction-corrected K correction applicable to SSCs used for calibrating SNeIa (Sect. 2.1), reviews the basics of the Wesenheit function, and presents the dependence of the Wesenheit function’s slope, RW, on redshift (Sect. 2.2). Redshift-Leavitt-bias corrections are recalled in Sects. 2.3 and 2.4 subsequently describes the combined relativistic distance correction and its application to H0. Section 3 presents the information used to estimate K corrections for the two SSCs under study: Cepheids and TRGB stars. Section 4 presents the results for Cepheids (Sect. 4.1) and TRGB stars (Sect. 4.2) based on synthetic spectrophotometry computed using stellar atmosphere models, a comparison of corrections applicable to the Cepheid methodology used by Riess et al. and the TRGB methodology employed by Freedman et al. (Sect. 4.3), an estimate of corrections applicable to the color-dependent TRGB methodology employed by the Extragalactic Distance Database (EDD; Anand et al. 2021b), and an assessment of the implications for H0 (Sect. 4.5). Section 5 provides additional discussion concerning the choice of input information (Sect. 5.1), guidance of the trends to be expected for Mira and J-region asymptotic giant branch (JAGB) stars (Sect. 5.2), and dust extinction (Sect. 5.3). The final section, Sect. 6, summarizes the results. Tabulated results are provided in electronic form at the CDS.
2. Methodology
2.1. The K correction
The K correction accounts for the difference between the (observed) apparent magnitude of a source and the apparent magnitude of the same source in its comoving (emitter) inertial frame. The difference is caused by two effects: a systematic shift of the SED incident on the photometric filter (bluer parts of the emitted SED pass through the photometric filter), and a dimming effect due to the fixed-width filter appearing compressed when viewed from the source. As explained in Anderson (2019), we compute K corrections using the observed redshift, z = zobs = (λ − λ0)/λ0, of SN-host galaxies (e.g., from Huchra et al. 1992), noting that z combines various redshift contributions (Calcino & Davis 2017). Following Hogg et al. (2002), the K correction is defined as
 (1)
(1)
where R and Q denote (possibly different) photometric filters in the rest-frames of the observer and emitter, respectively, m apparent magnitude, M absolute magnitude, and μ0 = 5log(DL/10 pc) the true distance modulus and its relation to luminosity distance DL. For spectral flux densities, fλ, expressed per unit wavelength (Eq. (12) Hogg et al. 2002):
![Mathematical equation: $$ \begin{aligned} K =&- 2.5\log {\left[\frac{1}{1+z}\right]} \nonumber \\&-2.5\log {\left[\dfrac{\int {\mathop {\mathrm{d}\lambda _{\rm o}}\lambda _{\rm o} f_\lambda (\lambda _{\rm o}) R(\lambda _{\rm o})}}{\int {\mathop {\mathrm{d}\lambda _{\rm o}} \lambda _{\rm o} g_\lambda ^R R(\lambda _{\rm o})}} \frac{\int {\mathop {\mathrm{d}\lambda _{\rm e}} \lambda _{\rm e} g_\lambda ^Q Q(\lambda _{\rm e})}}{\int {\mathop {\mathrm{d}\lambda _{\rm e}} \lambda _{\rm e} f_\lambda ([1+z]\lambda _{\rm e}) Q(\lambda _{\rm e})}}\right]}, \end{aligned} $$](/articles/aa/full_html/2022/02/aa41644-21/aa41644-21-eq5.gif) (2)
(2)
with gλ the standard source spectral flux density per unit wavelength, λo = (1 + z)λe the relationship between wavelength in the observer (subscript o) and emitter (e) inertial frames, R and Q the photometric transmission curves (filters), and log signifying the 10-base logarithm throughout this work. All magnitudes are in the Vega system, computed using the Vega spectrum provided by the pysynphot library1 to represent gλ.
Equation (2) requires detailed knowledge of the intrinsic source spectrum,  , since KQR is tied to luminosity or bolometric magnitude (cf. Humason et al. 1956, Appendix B and Hogg et al. 2002). However,
  is not usually known for SSCs. Instead, the absolute magnitudes of SSCs are determined by calibration, that is, by observing apparent magnitudes, converting them to an absolute magnitude scale using geometric distance measurements, d, and, where possible, correcting for dust extinction
  . With the exception of NGC 4258, SSC calibration is typically limited to objects closer than 100 kpc, that is, at distances where peculiar motion dominates over redshift due to cosmic expansion. We therefore make the simplifying assumption that SSCs are calibrated in the observer’s frame.
The K correction as defined in Eq. (2) does not account for dust extinction. Put differently, Eq. (2) holds if extinction can be perfectly corrected. Since this is not usually possible, and since different strategies for reducing sensitivity to extinction are employed for different SSCs, we considered three types of extinction in this analysis: Acal the dust extinction applicable to SSC calibration, Afg the extinction due to foreground dust, and Ahost the extinction due to localized host in the emitter frame. Extending Eq. (2) by Acal, Afg, and Ahost yields
 (3)
(3)
We applied dust extinction by multiplying continuous stellar flux densities with a particular reddening law and color excess value specified in E(B − V). Hence, the extinction operation includes both the change in source color (reddening) and the reduction in source intensity (dimming),
 (4)
(4)
where each value of a(λ) = 10−0.4 Aλ can be calculated for any filter assuming a reddening law when the color excess is known. The color excess in two filters, Λ1 and Λ2, is  , that is, the difference between intrinsic and apparent source color. Thus,
 (5)
(5)
where Λ denotes the filter used to estimate the dimming and Λ1, 2 the filters used to determine color excess. The ratio AΛ/(AΛ1 − AΛ2) is specified by a reddening law (e.g., Cardelli et al. 1989; Fitzpatrick 1999), which itself depends on source color, particularly so in the case of broadband photometry. We opted to not compute RΛ as a function of intrinsic source color in order to most closely follow observational practice. Instead, we computed RΛ using a slightly reddened E(B − V) = 0.1 spectrum of Vega adopting the Cardelli et al. (1989) reddening law for typical MW dust (i.e., RV = 3.1).
Dust extinction affects K corrections in two instances: (1) when transforming the calibrated SED to the emitter frame and (2) when computing the observed (dust extincted) source in the observer frame. To achieve (1), single-filter calibrations of SSCs require extinction corrections to avoid distance bias. Thus, the true (extinction-corrected) SED in the emitter frame  is assumed to be identical to
 (6)
(6)
Any systematic errors associated with this extinction correction will lead to a chromatic bias when transposing the calibrator source to the emitter frame.
To achieve (2), the observed target flux density  is shaped by two attenuation events occurring in different inertial frames:
![Mathematical equation: $$ \begin{aligned} f^{\mathrm{obs} }_\lambda (\lambda _{\rm o})&= \left[f_\lambda ^{\mathrm{true} }(\lambda _{\rm e}) \cdot a^{\mathrm{host} }_{\rm e}(\lambda _{\rm e})\right] \cdot a^{\mathrm{fg} }_{\rm o}(\lambda _{\rm o}) \nonumber \\&= f_\lambda ^{\mathrm{true} }\left(\left[\frac{\lambda _{\rm o}}{1+z}\right]\right) \cdot a^{\mathrm{host} }_{\rm o}\left(\left[\frac{\lambda _{\rm o}}{1+z}\right]\right) \cdot a^{\mathrm{fg} }_{\rm o}(\lambda _{\rm o}). \end{aligned} $$](/articles/aa/full_html/2022/02/aa41644-21/aa41644-21-eq16.gif) (7)
(7)
Hence, we computed  by successively applying the localized extinction in the emitter frame, blueshifting the SED to the observer frame, and applying foreground extinction. The center and right columns of Fig. 1 illustrate this.
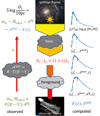 |
Fig. 1. Cartoon illustration of the applied methodology. Center: source progressively reddened and attenuated by dust, redshift, and distance. Right: host extinction, redshift, and foreground extinction successively applied to ATLAS9 SEDs before a synthetic photometry in the observer frame is performed to compute the “observed” SED used to compute the K correction and the apparent extinction correction based on apparent color excess. The dotted vertical lines indicate the position of the wavelength of the Ca II IR triplet in the emitter frame. Left: distance, DL, determined using observed apparent magnitude, mo, the observer-frame calibrated absolute magnitude, Mcal, the dust extinction corrections based on apparent color excess (E(B − V)), and estimates of foreground dust extinction (Afg). Image credit for M100 and HST: NASA/STScI. |
For K correction computations applicable to single filter observations, we assumed that calibration observations of SSCs are accurately extinction-corrected (i.e., acal = 1) and that foreground correction is accurately determined by foreground dust maps (i.e., afg = 1). For all single-filter results presented, we thus exclusively vary ahost < 1 to test the impact of different amounts of localized dust extinction, expressed in the conventional units of E(B − V) assuming the Cardelli et al. (1989) reddening law as explained above. Conversely for computations using the Wesenheit function, we adopted realistic sample averages for E(B − V)host and E(B − V)fg when computing  to remain sensitive to the interplay between redshift and the reddening law (cf. Sect. 2.2).
Starting from Eq. (3) and inserting Eqs. (4), (6), and (7), the extinction-dependent K correction becomes
![Mathematical equation: $$ \begin{aligned} K^{\mathrm{ext} } =&- 2.5\log {\left[\frac{1}{1+z}\right]}\nonumber \\&- 2.5 \log {\left[\dfrac{\int {\mathop {\mathrm{d}\lambda _{\rm o}} \lambda _{\rm o} f^{\mathrm{obs} }_\lambda (\lambda _{\rm o}) R(\lambda _{\rm o})}}{\int {\mathop {\mathrm{d}\lambda _{\rm o}} \lambda _{\rm o} g_\lambda ^R R(\lambda _o)}} \frac{\int {\mathop {\mathrm{d}\lambda _{\rm e}} \lambda _{\rm e} g_\lambda ^Q Q(\lambda _{\rm e})}}{\int {\mathop {\mathrm{d}\lambda _{\rm e}} \lambda _{\rm e} f^{\mathrm{true} }_\lambda ([1+z]\lambda _{\rm e}) Q(\lambda _{\rm e})}}\right]}\cdot \end{aligned} $$](/articles/aa/full_html/2022/02/aa41644-21/aa41644-21-eq19.gif) (8)
(8)
The Kext(Λ) in Eq. (8) by definition depends on extinction. While foreground and calibration extinction corrections are typically applied, direct measurements of  are difficult to obtain in practice due to observational limitations and because color excess as well as the ratio of total to selective extinction are affected by redshift (McCall 2004). Yet, observations may yield an approximate estimate using an apparent color excess calculated as the difference between the observed and the fiducial color of SSCs. Using this apparent color excess and assuming a reddening law, one may then compute an apparent extinction correction,
  to obtain an approximate correction for host extinction.
Approximating Ahost ≈ Aapp and after applying foreground and calibration extinction corrections, Eq. (3) simplifies to:
 (9)
(9)
with the extinction-dependent reduced K correction
 (10)
(10)
Of course,  requires knowledge of the fiducial color. If there is no host extinction altogether,
  after correcting for calibration and foreground extinction.
The following text primarily discusses K corrections for Cepheids and TRGB stars applicable to the most recent methodologies and filter combinations, although the results computed span a much wider range of stellar parameters. For Cepheids, we mostly consider measurements using the near-infrared (NIR) Wesenheit function, which is reddening-free by construction (cf. Sect. 2.2). Thus, we adopt realistic values for calibration, foreground, and host extinction to calculate  . Cepheid observations using individual passbands are discussed in terms of
  , that is, host extinction is corrected using the apparent color excess (cf. Tables A.1–A.3 that contain Kext(Λ) and
  separately for a broad range of E(B − V)host values).
For TRGB stars, we focus on Kext(F814W) assuming that calibration and foreground extinction is corrected, so that E(B − V)fg = E(B − V)cal = 0, and do not apply extinction corrections based on apparent color excess. The effect of neglecting small amounts of host extinction among TRGB stars are discussed in Sects. 4.3 and 5.3.
2.2. The Wesenheit function
The so-called Wesenheit function (van den Bergh 1975; Madore 1976) is commonly employed to reduce extinction-related issues of distance measurements thanks to its reddening-free construction for a given reddening law. Following Madore (1982) the Wesenheit function is defined as
 (11)
(11)
 (12)
(12)
is the total-to-selective extinction ratio as given by a reddening law, normalized to a specific value of RV, for any combination of filters Λ1, Λ2, Λ3. Specifically, the NIR Wesenheit function used to calibrate the Cepheid distance ladder (Riess et al. 2016, 2021a) uses  , where H, V, and I refer to Vega magnitudes in the F160W, F555W, and F814W filters of the Hubble Space Telescope’s Wide Field Camera 3 (HST/WFC3), respectively. According to Riess et al. (2016), the value of
  corresponds to a Fitzpatrick (1999) reddening law at RV = 3.3. Different reddening laws yield different values of
  for the same combination of filters and RV, so that
  depends on the assumed reddening law. Moreover,
  depends on the SED of the source. For example, we find
  for slightly reddened Vega spectrum assuming the Fitzpatrick (1999) reddening law and RV = 3.3. For a ∼10 d MW Cepheid at the center of the instability strip (IS; cf. Sect. 3.1), reddened by E(B − V) = 0.4, and assuming RV = 3.3, the Fitzpatrick (1999, henceforth: F99) reddening law yields
  . Adopting instead the RV = 3.1 Cardelli et al. (1989, henceforth: CCM) reddening law yields
  . Since dust extinction is a chromatic process sensitive to redshift (McCall 2004), RW strictly speaking only applies in the observer’s frame and must in principle be redshifted to the emitter frame when measuring distance to avoid a redshift-related reddening-law bias. Computing
  for the fiducial 10 d Cepheid yields
 (13)
(13)
The linear formulation of Eq. (13) is adequate at low redshift (e.g., z < 0.03); the relation becomes increasingly nonlinear at larger z.
Since the Wesenheit slope RW depends on redshift, and with ΔRW(z) = RW(z > 0)−RW(0), one may define a corrective term to apply to the absolute Wesenheit magnitude in the emitter frame:
 (14)
(14)
Thus,  for the CCM reddening law, and −0.105 ⋅ z ⋅ (V − I) for F99. Since ΔMW(z) < 0 (ΔRW(z) > 0, z > 0, and (V − I) > 0), the absolute Wesenheit magnitudes of Cepheids in SN-host galaxies are intrinsically slightly brighter than previously thought. Expressed as a bias correction for distances based on the Wesenheit function, we obtain
 (15)
(15)
so  for the CCM reddening law.
At z = 0.0245,  mmag for (V − I)≈1.0 mag, causing a 0.15% systematic distance error at 100 Mpc. The period-color relation of Cepheids further implies a small change of mean Teff as a function of pulsation period P, resulting in a minute period-dependence of observed Leavitt law (LL; period-luminosity relation) slopes in galaxies, depending on the range of Cepheid periods observed.
2.3. Redshift-Leavitt bias due to time dilation
Anderson (2019) described how time dilation between non-comoving inertial frames biases cosmological distance measurements based on LLs of variable stars. In essence, the observed period, Po, is a clock observed to tick more slowly than its true period in the emitter frame, Pe, and thus: Po > Pe. The difference in log P expected between the anchor galaxies belonging to the observer’s rest frame, and the receding SN-host galaxies is therefore Δlog P = log Po − log Pe = log[1 + z]. For stars following a linear LL of the form M = a + blog P, the resulting RLB leads to overestimated luminosity and an absolute magnitude bias ΔMRLB(z) = Mo − Me = blog[1 + z], which in distance modulus is expressed as
![Mathematical equation: $$ \begin{aligned} \Delta \mu ^{\mathrm{RLB} }(z) = - b \log {[1+z]}. \end{aligned} $$](/articles/aa/full_html/2022/02/aa41644-21/aa41644-21-eq46.gif) (16)
(16)
Since longer-period stars are brighter (b < 0) and redshift increases with distance (z > 0), the sign of the bias correction is generally positive (ΔμRLB > 0). Hence the true distances (μ0) are shorter than apparent distances measured without RLB-correction, and RLB-corrections tend to increase the value of H0 = v/DL.
2.4. Effect of relativistic corrections on the Hubble constant
Inserting Eqs. (16) and (15) into Eq. (3) yields the combined relativistic distance correction:
![Mathematical equation: $$ \begin{aligned} \Delta \mu ^{\mathrm{rel} }(z)&= \mu ^{\mathrm{obs} } - \mu _0 \nonumber \\&= K^{\mathrm{ext} } + \Delta \mu ^{\mathrm{RLB} }(z) + \Delta \mu ^{R^\mathrm{W}} \nonumber \\&= K^{\mathrm{ext} } - b \log {[1+z]} + \Delta R^\mathrm{W}(z) \cdot (\Lambda _2 - \Lambda _3), \end{aligned} $$](/articles/aa/full_html/2022/02/aa41644-21/aa41644-21-eq47.gif) (17)
(17)
where μobs is the distance modulus measured without applying relativistic corrections and μ0 the true distance modulus. Although both the RLB and Wesenheit slope corrections are small unto themselves, we note that they both increase Δμrel since the LL slope b < 0 and ΔRW(z) > 0. Depending on the sign of Kext(Λ), Δμrel(z) is thus either brought closer to 0 by the other two effects or is further driven toward larger (positive) values. Of course, RLB does not apply to TRGB stars. Additionally, ΔRW(z) = 0 when the Wesenheit function is not used. Thus, for the Wesenheit function applied to Cepheids, Δμrel(z) = Kext − blog[1 + z] + ΔRW(z)⋅(V − I). For TRGB stars observed in F814W, Δμrel(z) = Kext; if reddening corrections based on apparent color excess are included  . For TRGB distances by Anand et al. (2021a,b) employing the color calibration by Rizzi et al. (2007), we additionally considered the effect of redshifted colors in Sect. 4.4.
Using Eq. (17), the correction to apply to literature luminosity distance estimates, DL, is
 (18)
(18)
For reported H0 measurements based on distance ladders whose base calibration is provided by SSCs (e.g., Riess et al. 2016; Freedman et al. 2019), the correction then becomes
 (19)
(19)
Depending on the sign of Δμrel(z) > 0, reported values of H0 may require either upward or downward revisions, which would impact the significance of the discord between the present-day and early-Universe H0 determinations.
3. Fiducial information used for Cepheids and TRGB stars
The formalism outlined in Sect. 2 requires detailed knowledge of stellar SEDs over a wide wavelength interval, in particular when considering Wesenheit magnitudes. To investigate the interplay of K corrections with stellar parameters, reddening, and redshift, we opted to base this investigation on the library of synthetic ATLAS9 stellar model atmosphere grid included in the python library pysynphot2 (STScI Development Team 1975; Castelli & Kurucz 2003). The parameter range covered by these models (Teff > 3500 K, log g < 0) allowed us to investigate Cepheids and TRGB stars, and the following subsections describe the parameters adopted to represent these stars. Unfortunately, limitations of the ATLAS9 models precluded the computation of K corrections for cooler SSCs, such as oxygen-rich Mira variables (e.g., Whitelock et al. 2008; Huang et al. 2020) and the recently introduced J-region AGB stars (Madore & Freedman 2020; Zgirski et al. 2021). Some extrapolations of our results to these promising SSCs are discussed in Sect. 5.2. Additional considerations concerning the use of models over empirical SEDs are presented in Sect. 5.1.
All photometric transmission curves (filters) were downloaded from the Spanish Virtual Observatory Filter Profile Service34. We computed results for HST/WFC3 filters F555W, F814W (UVIS channel), and F160W (IR channel), as well as the Advanced Camera for Surveys’ (HST/ACS) F606W filter, since these are extensively used to measure H0 to great precision (Riess et al. 2018, 2021a; Freedman et al. 2019). Other filters are straightforward to include and we ensured that differences between F555W and F814W yield negligible differences among HST/WFC3 and HST/ACS. In anticipation of this year’s launch of the JWST, we included the broadband NIRCAM filters F115W, F150W, F200W, and F277W. 2MASS filters J and Ks are also included for reference. In the context of the Wesenheit function, HST filters are occasionally abbreviated to H (F160W), V (F555W), and I (F814W) band for better legibility.
3.1. Classical Cepheids
Classical Cepheids are pulsating yellow (super-)giant stars whose spectral types range from mid-F to early-K. Their chromatic pulsations cause Teff to vary with pulsation phase at an amplitude frequently exceeding 1000 K (e.g., Kovtyukh et al. 2005). Cepheids obey LLs (period-luminosity relation; Leavitt & Pickering 1912) that allow the inference of luminosity, L, from the straightforward period (P) measurement. Cepheid pulsations are driven primarily by the κ Mechanism, which requires a particular stellar structure to operate and confines Cepheids to a near-vertical strip in the Hertzsprung-Russell diagram (HRD). This narrow region, the so-called classical IS, has a small finite width in Teff at fixed L. Since the IS is furthermore sloped toward cooler temperatures at higher L, there exists also a period-color relation (or an L − Teff relation) so that hotter Cepheids of period P are more luminous than their cooler cousins with identical P due to the Boltzmann law. Classical (linear) LLs marginalize over such effects, leading to intrinsic LL scatter due to several astrophysical processes (e.g., Anderson et al. 2016). The range of Teff at any given P is up to several hundred kelvins (cf. Fig. 2). However, it is important to note that the IS is not homogeneously sampled due to the varying evolutionary timescale along the blue loop evolution, which makes it more likely to observe Cepheids closer to the hot IS boundary compared to the cool IS boundary. Given the uncertainties of the absolute position of the IS, we opted to consider Cepheids at the center of the IS.
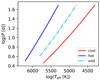 |
Fig. 2. Dependence of log P on Teff determined based on the pulsation analysis of Geneva stellar evolution models for solar metallicity for Cepheids with typical initial rotation (ω = 0.5) (Anderson et al. 2016). The blue dash-dotted line represents the midpoint between the hot and cool edges of the IS, and we average over the second crossing. |
We determined Teff at the center of the classical IS using the published pulsation analysis of Geneva stellar evolution models (Anderson et al. 2016; Georgy et al. 2013; Ekström et al. 2012 for model details). For solar metallicity (Z = 0.014) Cepheids, we found
![Mathematical equation: $$ \begin{aligned} \log {(T_{\mathrm{eff} }\,\mathrm{[K]})} = -0.0753 \cdot \log {P} + 3.8094. \end{aligned} $$](/articles/aa/full_html/2022/02/aa41644-21/aa41644-21-eq51.gif) (20)
(20)
Thus, a 10 d solar metallicity Cepheid at the center of the IS is expected to have Teff = 5421 K. This is close to the mean Teff = 5340 K of 22 MW Cepheids with 9.4 < P < 10.4 d whose temperatures have been determined by fitting photometrically sampled SEDs (Groenewegen 2020). At lower metallicities, the IS boundaries become hotter and steeper in the HRD. For lower metallicity models, we found log T = −0.0608 ⋅ log P + 3.8043 (LMC, Z = 0.006) and log T = −0.0568 ⋅ log P + 3.8073 (SMC, Z = 0.002).
Since Cepheids also obey a period-radius relation, we fitted a crude relation between cycle-averaged log g and log P based on measurements of 14 Galactic Cepheids presented by Proxauf et al. (2018) and found
 (21)
(21)
For a 10 d MW Cepheid, Eq. (21) yields log g ≈ 1.3. In line with these empirical values, we adopted for the fiducial 10 d MW Cepheid model an ATLAS9 atmosphere with the parameters Teff = 5400 K, log g = 1.5, and [Fe/H] = 0.0.
For computations using the Wesenheit function, we adopted a mean color excess E(B − V) = 0.4 for computing Acal; this corresponds to the mean value (Groenewegen 2018, 0.40 ± 0.02 mag) of the 75 MW Cepheids for which HST photometry has been collected (Riess et al. 2018, 2021a). We further adopted E(B − V)fg = 0.0223 mag for computing Afg in the case of Wesenheit magnitudes to match the mean foreground reddening (Schlafly & Finkbeiner 2011) of the 19 SN-host galaxies in Riess et al. (2016). Different values ranging from E(B − V) = 0 to 0.5 mag were used to investigate host reddening, covering a range of twice the spectroscopically measured reddening of a blue supergiant star in NGC 4258 (Kudritzki et al. 2013, E(B − V) = 0.23 ± 0.03 mag). Selecting SN-host galaxies with low inclinations, low reddening, and applying selection cuts to Cepheid candidates (e.g., mean color), is expected to constrain the range of true host reddenings to within the range adopted here.
3.2. Stars near the TRGB
The TRGB coincides with a well-defined evolutionary stage of low-mass stars before the He flash (e.g., Salaris & Cassisi 1997; Serenelli et al. 2017). It has been used extensively to measure distances to hundreds of galaxies within ∼10 Mpc (e.g., Rizzi et al. 2007; Jacobs et al. 2009; Anand et al. 2021b) and to calibrate the SNIa luminosity zero point for measuring H0 (e.g., Lee et al. 1993; Jang & Lee 2017; Freedman et al. 2019; Freedman 2021; Anand et al. 2021a).
The magnitude of the TRGB is determined by a marked decrease in the luminosity function along the red giant branch (RGB), located approximately at an absolute F814W magnitude of −4.06 mag (e.g., Cerny et al. 2020; Jang et al. 2021; Hoyt 2021). Near the I band, and for a restricted range of parameters, the TRGB is roughly flat in color, whereas its slope changes from decreasing with color for shorter-wavelength observations to increasing with color for longer-wavelength observations (e.g., Valenti et al. 2004; Freedman et al. 2019; McQuinn et al. 2019; Madore & Freedman 2020). The basis for using the TRGB as a standard candle is that the luminosity of RGB stars cannot exceed a certain luminosity without triggering very rapid ignition of He burning in the degenerate core, which displaces stars toward higher temperature and lower luminosity onto the red clump (higher metallicity) or the zero-age horizontal branch (ZAHB; lower-metallicity populations). Details concerning the dependence of TRGB luminosity on chemical composition, core convection, age, and so on, are found in, for example, Cassisi (2017) and Serenelli et al. (2017). According to stellar evolution models, the TRGB’s HRD position depends sensitively on metallicity, moving to hotter temperatures for lower metallicity, as well as age. Observationally, these issues can be mitigated either by focusing exclusively on low-metallicity stellar populations older than several (≳4) Gyr (Freedman et al. 2020) or by correcting the absolute magnitude using a color term (Rizzi et al. 2007).
We consulted literature on spectroscopic studies of the RGB to determine the properties of a fiducial star at the TRGB. Lemasle et al. (2014) measured spectroscopy of metal-poor red giant stars in Fornax where the TRGB is clearly distinguishable. Their parameters for star “m0714” near the TRGB are Teff = 4090 K, log g = 0.50, [Fe/H] = −1.80; for the somewhat more metal-rich star “m0631” Lemasle et al. (expectedly) found the lower temperature Teff = 4035 K, log g = 0.55, [Fe/H] = −0.85. The study of rotational broadening along (presumably even more metal-rich) field red giants by Cortés et al. (2009) placed the TRGB near log g ≈ 0.2 and Teff ≈ 3890 K.
As a cross-check and to reduce the effect of high-metallicity interlopers, we also determined the parameters for the fiducial TRGB stars by consulting synthetic populations based on PARSEC isochrones computed via the CMD webtool V3.4 (Bressan et al. 2012; Chen et al. 2019)5. We adopted the parameters of ω Cen from Soltis et al. (2021) to compute 5 separate old and metal-poor (11.5 Gyr, [Fe/H] = −1.7) populations of 105 M⊙. The most luminous stars in the I, V − I color-magnitude diagrams based on the retrieved synthetic populations suggest Teff = 4300 K, log g = 0.5, and [Fe/H] = −1.7 as the fiducial parameters for TRGB stars. For the same age (11.5 Gyr) and higher metallicity ([M/H] = −0.7), these parameters shift to Teff = 3850 K, in line with the spectroscopic results mentioned above. We thus average between the theoretical TRGB star and the “m0714” star in Lemasle et al. (2014) and adopt Teff = 4200 K, log g = 0.5, and [Fe/H] = −1.75 for the fiducial stellar parameters at the TRGB.
Dust extinction is explicitly considered during the absolute magnitude calibration of the TRGB. Specifically, the recent H0 measurement reported by Freedman (2021) relied on TRGB absolute magnitude calibrations from four different sets of data, including MW Globular clusters (Cerny et al. 2020, reddening corrected based on the literature compilation of color excesses in Harris 1996 (2010 edition)), the SMC and the LMC (Hoyt 2021, reddening correction based on the Skowron et al. 2021 reddening maps derived using red clump stars), and the megamaser host galaxy NGC 4258 (Jang et al. 2021, reddening corrected using all-sky maps). The prior H0 measurement by Freedman et al. (2020) had relied exclusively on a separate LMC absolute magnitude calibration where multiband photometry was used to correct extinction effects directly without resorting to external measurements. Semi-theoretical reddening maps toward the Magellanic Clouds recently presented by Nataf et al. (2021) are generally consistent with the empirical maps by Skowron et al. (2021), who also provided an in-depth discussion of pros and cons of various reddening map determinations.
We note a potentially interesting conceptual difference between the reddening corrections applied to the TRGB calibration in the Magellanic Clouds versus the calibration based on the TRGB in NGC 4258 and the MW globular clusters. The reddening estimates in the Magellanic clouds are based on well-traceable charge-coupled device photometry of red clump stars, which are in a similar evolutionary state as the stars near the TRGB and exhibit similar colors. Conversely, the reddening estimates of MW globular clusters in Harris (1996, 2010 edition) are not readily traceable in detail, and the online bibliography67 states that most reddening estimates are averages of color-magnitude diagram-based reddenings reported in the 1980s (Webbink 1985; Zinn 1985; Reed et al. 1988). The reddening correction to the TRGB in NGC 4258 is based on the Schlafly & Finkbeiner (2011) recalibration of the Schlegel et al. (1998) all-sky reddening maps and thus does not use stellar standard crayons at all. Despite these systematic differences among the calibrating sets, the following considers extinction to be accurately corrected during absolute calibration so that E(B − V)cal = 0.
Foreground dust extinction is usually considered explicitly based on all-sky reddening maps. We thus consider that foreground extinction is adequately removed and set E(B − V)fg = 0.
Localized extinction in SN-host galaxies (host extinction) is not usually considered and is indeed explicitly neglected when measuring distances via the TRGB method. As mentioned repeatedly by Freedman et al. (2019, 2020), Freedman (2021), galactic halos are assumed to be entirely devoid of gas and dust and, hence, of any extincting material because observations point to very low levels of extinction in galaxy halos. However, any amount of gas or dust leads to net extinction effect, which formally invalidates this assumption and introduces a (small) distance bias, since the systematic uncertainty due to host extinction is not Gaussian with zero mean.
Host extinction of relevance to TRGB stars can arise from two main sources. Firstly, the circumgalactic medium (CGM) extends well into galaxy halos with contributions from inflowing gas as well as feedback from the supermassive black holes at the centers of galaxies (for reviews on the subject, cf. Putman et al. 2012; Tumlinson et al. 2017), and the composition and origin of the CGM is a very active subject of research for galaxy evolution (e.g., Anand et al. 2021c). The typical color excess due to the CGM has been measured to be E(B − V)≈0.01 mag within a few tens of kiloparsecs from the galaxy center along the semimajor axis (e.g., Zaritsky 1994; Ménard et al. 2010; Peek et al. 2015). Overall, CGM reddening is most efficiently avoided by observing the TRGB in the outer halos, where the detection of the TRGB is also generally much cleaner (Jang et al. 2021).
Localized extinction can also arise from circumstellar environments (CSEs) fed by mass loss during RGB evolution (Reimers 1975; Schröder & Cuntz 2005). Old RGB stars lose approximately 0.2 M⊙ by a magneto-hydrodynamic mechanism (Alfvén waves) during their ascent to the tip, and this amount of mass loss has been observationally found to be fairly independent of mass and metallicity (Dupree et al. 2009; Gratton et al. 2010; Cranmer & Saar 2011; McDonald et al. 2011a,b; Miglio et al. 2012; McDonald & Zijlstra 2015; Salaris et al. 2016; Tailo et al. 2021). Red clump stars are likely to have lost similar amounts of mass as stars near the TRGB. Stellar encounters, in particular in globular clusters, could further enhance mass-loss rates (Pasquato et al. 2014). At luminosities exceeding log L/L⊙ ≈ 3, RGB stars further become subject to dust-driven mass loss (Groenewegen 2012). Since the TRGB reaches very close to this cut-off luminosity, it remains an open question whether dust-driven mass loss could be relevant, perhaps especially for cooler, more metal-rich specimen. As pointed out by Cassisi (2017), there is not yet consensus on how to incorporate these effects in stellar evolution models, which typically assume the much weaker Reimers (1975) mass-loss rates, or in population synthesis codes. Thus, we can currently only speculate about how strongly the material lost could redden or attenuate RGB stars.
Given these considerations, we expect localized extinction to be small, albeit nonzero, and compute K corrections for a range of small range of E(B − V)host < 0.05 mag values to compute Ahost to assess the combined effects. Unless otherwise specified, values of Kext(Λ) discussed in the following assume a typical host reddening of E(B − V)host = 0.01 mag due to the CGM alone. Any potential extinction by CSEs (due to mass loss) has not yet been sufficiently quantified and remains a subject for future research.
4. Results
We computed a grid of K corrections for a wide parameter range covering Teff between 3500 and 6000 K; log g between 2.0 and 0.0; [Fe/H] between −2.0 and 0.5; redshift z between 0.005 and 0.030, and host reddening E(B − V)host between 0.0 and 0.5 mag in the HST/WFC3 filters F555W, F814W, and F160W, 2MASS J & Ks, and JWST/NIRCAM filters F115W, F150W, F200W, and F277W. As explained above, calibration and foreground extinction are set to zero for these single-filter calculations. Table A.1 illustrates a small subset of the grid. Table A.2 lists optical-NIR Wesenheit K corrections, RLB corrections, and the Wesenheit slope correction for Cepheids and E(B − V)cal = 0.4 mag, E(B − V)fg = 0.0023 mag, and a range of E(B − V)host values. A separate grid was computed for stars near the TRGB for a smaller and denser range in E(B − V)host between 0.000 and 0.050 mag and including HST/ACS filters F606W and F814W (cf. Table A.3). Tables A.1–A.3 are made available in their entirety at the CDS.
Figure 3 illustrates the results of this grid computation for HST passbands (Λ) F814W, F160W, the NIR Wesenheit function, and the JWST/NIRCAM F200W filter for models with log g = 1.5, solar iron abundance, and neglecting reddening. The run of K(Λ, z) is smooth and monotonic for each temperature, though not necessarily linear. K(Λ, z) becomes increasingly positive with wavelength, changing sign from negative to positive near 2 μm for most models (cf. Fig. 4). K(Λ, z) depends less and less on Teff with increasing wavelength, leading to large scatter in F814W and rather consistent values in F200W. At F277W, the spread in K(Λ, z) is again larger than in F200W. At first sight, the NIR Wesenheit function mainly resembles the F160W variation. However, closer inspection shows that hotter Teff results are compressed together while the difference with the coolest stars is close to that seen in F160W, implying a significant nonlinear dependence on Teff for cooler stars. Additional detail for Cepheids and TRGB stars is provided in the following subsections.
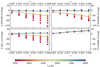 |
Fig. 3. K corrections as a function of redshift, z, and Teff for different filters of interest for the simplified case without extinction. Circles show results for Teff ∈ [3500, 6000] K (from red to blue circles; cf. the color bar below), with fixed log g = 1.5 and [Fe/H] = 0.0. The fiducial 10 d MW Cepheid analog is shown by thick solid lines. Results for the fiducial TRGB star ([Fe/H] = −1.75) are shown as thick dashed black lines. |
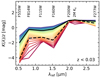 |
Fig. 4. K corrections divided by redshift, z, as a function of filter reference wavelength for stars of different temperatures (same scale as in Fig. 3) for the simplified case without extinction. The fiducial 10 d MW Cepheid analog is shown as a thick black solid line, and the fiducial TRGB star as a thick dashed black line. K corrections in the JWST/NIRCAM F200W and 2MASS Ks filters are particularly insensitive to temperature differences. K corrections become increasingly positive and less filter-sensitive with wavelength. |
4.1. Classical Cepheids
This subsection presents K corrections for Cepheids in two steps. Section 4.1.1 begins with a description of the fiducial 10 d MW Cepheid (cf. Sect. 3.1) to guide further application to H0 measurements. In turn, Sect. 4.1.2 discusses various additional effects, such as varying Teff due to pulsations, the intrinsic width of the IS, and the average IS position as a function of chemical composition.
4.1.1. The fiducial 10 d MW Cepheid
Figure 3 immediately shows that K remains rather close to zero for F814W, F160W, and the Wesenheit function and moves to increasingly positive values for the longer-wavelength F200W filter for the fiducial 10 d Cepheid. To obtain a closer appreciation of the dependence of K on redshift and filter, we computed K corrections for the fiducial Cepheid model and fitted linear or quadratic relations to  for each filter. We note that these values of
  are based on an assumed host reddening of E(B − V)host = 0.20 mag and a correction based on the apparent color excess (cf. Eq. (10)). Quadratic relations were adopted where a clear deviation from linear was visible by eye. The fitted relations for
  are listed in Table 1 and illustrated in the left panel of Fig. 5.
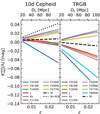 |
Fig. 5. Illustration of extinction-dependent reduced K corrections as a function of redshift for a 10 d Cepheid listed in Table 1 and stars near the TRGB listed in Table 3. The results shown assume host reddening of 0.20 mag and 0.00 mag for Cepheids and TRGB stars, respectively. For Cepheids, |


Coefficients for K corrections as a function of redshift for 10 d Cepheids.
Several aspects are readily apparent in Fig. 5: (1)  can deviate 0 at low z due to imperfect extinction corrections based on apparent color excess (most apparent in F814W); (2) the sign of K changes from negative to positive at wavelengths slightly longer than F160W (H band); (3) K for the Wesenheit function is very close to 0 and does not strongly depend on z; (4) K exceeds > 1% in distance for objects farther than 100 Mpc in filters F555W, Ks, F200W, and F277W. (5) The F555W distance error exceeds 1% at ∼50 Mpc.
The insensitivity of the NIR Wesenheit function to K corrections is quite remarkable. Changes in the assumed value of RV used for computation of the Wesenheit slope do not significantly change this picture. Applying the redshift-correction to the Wesenheit slope (Eq. (13)) also does not visibly affect the run of K(WH, VI, z) on the scale shown in Fig. 5.
Figure 5 also hints at the interesting possibility of directly measuring  at the longer redshift ranges by comparing distances to the same SN-host galaxies observed in filters with oppositely signed K corrections. While this will be extremely challenging for Cepheids, TRGB stars (right panel, Sect. 4.2) may exhibit a difference of up to Δμ ≈ 0.06 mag between the JWST/NIRCAM filters F200W and F150W. Directly detecting such a systematic chromatic dependence of measured distance modulus on z would provide a direct confirmation of the relativistic effects associated with cosmic expansion.
To compute the full relativistic distance bias, Eq. (17) adds to  contributions by RLB and the Wesenheit slope dependence on z. Figure 5 illustrates the impact RLB for the example of the Wesenheit function K(WH, VI, z). The RLB depends on the photometric filter due to the LL slope dependence on wavelength (steeper at longer wavelength). Hence, the offset applicable to other photometric filters differs in detail, but not in direction, since the LL slope is always negative. Thus, for all photometric filters, RLB would bring
  in F555W much closer to 0, whereas it would tend to exacerbate the positively signed values of
  for longer-wavelength filters.
4.1.2. Temperature dependence: Leavitt law slope and phase dependence
The temperature dependence of K (Fig. 3) impacts Cepheids in two ways. Firstly, the Teff dependence on log P illustrated in Fig. 2 leads to a log P dependence of K, which leads to a small LL slope dependence on redshift. This effect correlates with the selection bias of preferentially detecting longer-period Cepheid in more distant galaxies due to their greater intrinsic luminosity. Secondly, Cepheid pulsations modulate Teff in excess of 1000 K between phases of minimum and maximum light, leading to phase-dependent K corrections.
We computed K(log P, z) = m ⋅ log P + c at several redshifts and for several filters Λ by converting input values of log P to Teff and log g using Eqs. (20) and (21). Figure 6 illustrates the results for SN-host galaxies at 23 Mpc, and Table 2 lists the coefficients determined for a range of different redshifts from NGC 4258 to the Coma cluster. Interestingly, the slope for the Wesenheit function is close to 0 over the redshift range where it is reasonable to hope for Cepheids to be observed in the foreseeable future. For individual filters this is not necessarily the case, however. In F160W, the slope effect leads to a difference of ∼0.014 mag per log P between nearby Cepheids and Cepheids in the Coma cluster.
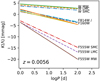 |
Fig. 6. K corrections for Cepheids as a function of log P for different metallicities, computed assuming a redshift difference of 0.0056 (∼23 Mpc) for several filters and assuming no extinction. Line styles identify the adopted metallicity of the MW (solid lines), the LMC (dashed lines), and the SMC (dash-dotted lines). |
Filter-dependent K corrections for fiducial 10 d Cepheids.
Figure 6 also illustrates the impact of chemical composition on Cepheid K corrections, since the center position of the IS moves to hotter temperatures at lower metallicity (Sect. 3.1). It shows K corrections computed at z = 0.0056 (∼23 Mpc) for the NIR Wesenheit function and its constituent filters computed for a range of input log P values and iron abundances matching the metallicity of the Sun, the LMC, and the SMC Cepheid populations: [Fe/H] = 0.0, −0.3, and −0.7. As could be expected, the log P dependence of Kext(Λ) is only slightly modified by metallicity. The largest effect is seen in F555W, which coincides nearly with the peak of the Cepheid SED. We conclude that chemical composition has no significant impact on K corrections of Cepheids.
Figure 7 illustrates phase and host reddening dependences for a long-period Cepheid similar to X Cyg (P = 16.4 d) with Teff = 5267 K and a temperature amplitude of ∼1300 K (Kovtyukh et al. 2005), observed at z = 0.0056 (23 Mpc). In low-reddening environments, phase variations in K are generally at the single-digit mmag level and can be safely ignored for distance measurements determined on cycle-averages. The phase dependence becomes greatest at hotter temperatures and for high host reddening, but remains limited to ≲0.01 mag between phases of extreme Teff differences. Thus, temperature variations due to pulsations do not significantly modify Kext(WH, VI).
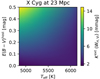 |
Fig. 7. Wesenheit K corrections for an X Cyg-like Cepheid (16.4 d) at 23 Mpc as a function of phase (by proxy of Teff) and assuming different amounts of host reddening. The most significant phase variation is seen for the highest amount of reddening, where Kext(WH, VI) may differ by as much as 0.01 mag among phases of extreme Teff values. |
4.2. K corrections for TRGB distances
The right panel of Fig. 5 illustrates the dependence of K(Λ) for TRGB stars observed in various filters assuming no host reddening, as tabulated in Table 3. The transition from negative to positive values of K happens at the same reference wavelength as for Cepheids; roughly at 2 μm (F200W). For filters where K is positive, the pattern resembles that seen in the left panel for Cepheids, with marginally larger spread. For filters where K is negative, however, the spread grows more rapidly as a function of z than for Cepheids. We find a ∼0.06 mag difference in K(Λ) between filters F150W and F200W at Coma cluster distances, which could allow for a future observational test of the predicted K corrections using JWST. The optical filters F555W and F606W require the largest negative K corrections, which already reach or exceed ∼1% at 20 Mpc.
Filter-dependent TRGB K corrections as a function of redshift.
For low-metallicity ([Fe/H] = −1.75) TRGB stars, differences in K(F814W) within the temperature range Teff = 4200 ± 100 K, computed as hotter minus cooler star, are at the level of −0.6 mmag (−3 mmag) at 20 Mpc (100 Mpc). Varying instead metallicity between [Fe/H] = −1.75 and −0.75 yields similar differences, computed as more metal-poor minus more metal-rich star, of −0.7 mmag and −4.4 mmag at 20 Mpc and 100 Mpc, respectively.
The impact of host extinction (cf. Sect. 3.2) on TRGB distances was considered by computing a smaller, separate grid for temperatures near the fiducial TRGB Teff, log g, low metallicity, and a finely sampled range of small E(B − V)host values. These results are included as Table A.3. Even small amounts of host reddening can cause Kext(F814W) to change sign from negative to positive. For example, Kext(F814W) = − 0.007 (−0.036) and +0.011 mag (−0.018) at ∼20 Mpc (100 Mpc) for E(B − V)host = 0.0 and 0.01, respectively. At longer wavelengths, reddening has a much reduced effect, of course, leading to Kext(F160W) = − 0.008 (−0.040) and −0.002 (−0.034) mag, respectively.
The sensitivity of Kext(F814W) to reddening and redshift can be understood by considering that SEDs of early K giants peak slightly blueward of the F814W filter (cf. Fig. 8). This leads to two effects: (1) the exponential nature of dust attenuation (Eq. (4)) significantly reduces the flux incident on the F814W filter even for a very low extinction values; (2) reddening progressively shifts the SED peak from blueward of the F814W filter to squarely within it, thereby changing the SED slope incident on the filter and causing sign reversal of K.
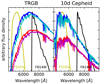 |
Fig. 8. Spectral energy distribution incident on HST/WFC3 filters F555W (yellow) and F814W (black) for a typical TRGB star (left) and a 10-day Cepheid (right). Un-reddened spectra at rest are plotted in dark blue and the un-reddened spectra at z = 0.025 in cyan. Spectra reddened by E(B − V) = 0.10 mag are shown at rest (red) and at z = 0.025 (magenta) for illustration purposes. The sensitivity of stars near the TRGB observed in F814W to even light reddening and small redshift is readily apparent and mirrors that of 10 d Cepheids observed in F555W. |
The Wesenheit function could help reduce sensitivity to such issues thanks to its very small K correction across the redshift range considered. TRGB distances based on the Wesenheit function would be insensitive to relativistic effects and reddening at the 1% level even at 100 Mpc. Even if no reddening is considered (as in right panel of Fig. 5), the Wesenheit K correction is smaller in absolute value than the one applicable to F277W. Further benefits of the Wesenheit function include reduced sensitivity to Teff and metallicity, that is, the parameters of the TRGB host populations.
4.3. Comparing Δμrel for the TRGB and Cepheids
The most recent Cepheids-based H0 value from Riess et al. (2021a, H0 = 73.2 ± 1.3 km s−1 Mpc−1) and the TRGB-based value by Freedman (2021, H0 = 69.8 ± 1.7 km s−1 Mpc−1) differ by Δμ ≈ 5log(73.2/69.8) = 0.103 mag, and the origin of this 1.6σ difference is much discussed (e.g., Freedman 2021; Anand et al. 2021b). Reducing this difference to 1.0σ would require a shift of Δμ1σ = 0.065 mag. Following the above general discussion of K corrections for Cepheids and TRGB stars, this subsection seeks to understand whether the investigated mechanisms can reconcile the two measurements at 1σ. Additional considerations for the recent TRGB methodology employed by the Cosmicflows team (Tully et al. 2013) are presented in Sect. 4.4 below.
To this end, we computed the combined relativistic distance correction (Eq. (17)) at the current average SN-host redshifts. For Cepheids, we used temperatures representative of pulsation periods P = 5 d to 60 d as per Eq. (20), while for TRGB stars we investigated a broad range ±200 K around the fiducial temperature of 4200 K. For Cepheids, we considered wider range of host reddenings (E(B − V)host between 0.0 and 0.5 mag) than for TRGB stars (E(B − V)host between 0.0 and 0.05). We considered measurements based on the Wesenheit function for Cepheids, whereas we computed Kext(F814W) for TRGB stars (i.e., the extinction-dependent K correction without applying a correction for host extinction).
Figure 9 illustrates both results at z = 0.005, which is close to the average SN-host distances of approximately 20 Mpc (Riess et al. 2016; Freedman 2021). The dependence of Kext(WH, VI) on host extinction is very minor for the fiducial Cepheid, and only slightly larger for the cooler, longer-period Cepheids (cf. also Sect. 4.1.2). Assuming a typical host extinction of E(B − V) = 0.20 and accounting for RLB as well as the redshifted reddening law yields a distance bias correction of Δμrel ≈ 0.012 mag, of which 0.007 mag are due to RLB, which quickly becomes the dominant relativistic effect at greater redshifts.
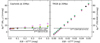 |
Fig. 9. Distance modulus bias at 20 Mpc as a function of host reddening for Cepheids observed using the optical-NIR Wesenheit function (left) and the TRGB calibrated in the F814W filter (right). Symbols show stars of different temperature, for Cepheids corresponding to pulsation periods of 5, 10, and 60 d (cyan, yellow, and magenta circles, respectively) and for TRGB stars for fiducial Teff of 4100, 4200, and 4300 K (magenta, yellow, and cyan downward triangles). The solid horizontal line for Cepheids indicates the K correction alone for host reddening corresponding to E(B − V) = 0.20 mag. The dashed horizontal lines illustrate the preferred corrections; for Cepheids, this includes corrections for RLB and the redshifted reddening law, for TRGB stars a halo extinction of E(B − V) = 0.01 mag. The solid black circle in the right panel illustrates the amount of host reddening at which Cepheid and TRGB-based H0 measurements would become consistent to within their joint 1σ uncertainty. The ordinate of this point is the sum of the 0.012 mag correction applicable to Cepheids and the current 0.065 mag shift required to render both (uncorrected) H0 measurements consistent with each other to within 1σ. |
For TRGB stars, Kext(F814W) exhibits a rather steep dependence on E(B − V), which could be reduced by applying reddening corrections, for example via the apparent color excess relative to a fiducial color (Eq. (10)). At z = 0.005, Δμrel exhibits a slope of approximately 0.018 mag per 0.01 mag E(B − V)host. As mentioned in Sect. 3.2, studies of the CGM have measured CGM reddening on the order of 0.01 mag in resolved galaxies at impact parameters of up to a few tens of kiloparsecs where TRGB measurements are made (e.g., Ménard et al. 2010; Peek et al. 2015). Adopting the typical value of E(B − V)host = 0.01 mag, we find Δμrel ≈ 0.011 mag, which is nearly identical to the correction applicable to Cepheids.
Additional uncorrected localized extinction applicable to TRGB distances may arise due to CSEs, although the magnitude of this effect and its dependence on wavelength remain open questions at this time. Nevertheless, any amount of additional host reddening increases Δμrel and reduces the difference in H0 measured using Cepheid and TRGB calibrations of SNeIa. Hence, it is interesting to check whether two H0 measurements could be reconciled to within a combined 1σ confidence interval by localized extinction, which would require a correction of Δμrel = 0.065 + 0.012 = 0.077 mag, which would correspond to E(B − V)host = 0.046 mag (cf. the filled black circle in the right panel of Fig. 9).
To test a possible contribution of CSEs to localized extinction, we considered the difference in the absolute F814W magnitude reported for the TRGB in the Magellanic Clouds (Hoyt 2021), NGC 4258 (Jang et al. 2021), and 46 MW globular clusters (Cerny et al. 2020). Since the reddening maps of the Magellanic Clouds (Skowron et al. 2021) used by Hoyt are based on red clump stars, one may expect that these stars would have experienced similar mass loss as stars near the TRGB. On the other hand, the reddening corrections applied to NGC 4258 (all-sky reddening maps by Schlegel et al. 1998; Schlafly & Finkbeiner 2011) and the MW TRGB (color-magnitude diagrams of main sequence cluster members compiled in Harris 1996, 2010 edition) should not be sensitive to CSEs.
Hence, the difference between the averages of both calibration groups may be sensitive to CSE reddening, and we find ΔMF814W = ⟨MF814W⟩LMC, SMC − ⟨MF814W⟩N4258, MW = 0.005 mag. Although the sign of this difference is consistent with an unaccounted for extinction contribution among the TRGB measured in NGC 4258 and the MW (the calibrated absolute magnitude is too bright if extinction is not adequately corrected), we note that the difference of 0.005 mag is much smaller than the 0.046−0.010 = 0.036 mag required to render Cepheid and TRGB H0 values consistent to within 1σ. Hence, our methodology cannot reconcile the reported disagreements between Cepheid and TRGB distances, unless CSEs of TRGB stars contribute additional localized reddening at the level of 0.04 mag. We stress that this simple consideration should not be considered a detection of reddening due to CSEs. Detailed research is required to assess the possible impact of stellar mass loss and CSEs on TRGB distances.
Interestingly, relativistic corrections for F814W observations of the TRGB and the Wesenheit function of Cepheid stars increasingly differ at greater redshifts. At z = 0.025, we find  mag (Kext(Λ), RLB, and ΔRW terms listed separately). Thus, RLB dominates over the effect of K corrections at distances of order 100 Mpc. For the F814W TRGB and host reddening of E(B − V)host = 0.01 mag, we find
  mag. It remains to be seen whether future observations will be precise enough to unambiguously detect this small systematic difference of 0.064 mag between the two methods.
Figure 10 compares the combined relativistic distance corrections applicable to the TRGB and Cepheids for broadband JWST passbands as a function of redshift and assuming host reddenings of 0.01 mag and 0.20 mag, respectively. For Cepheids, RLB corrections are also included using approximate LL slopes (inspired by multiwavelength results in Madore et al. 2017). The figure clearly illustrates the importance of accurate reddening corrections for Cepheids, even at NIR magnitudes, which requires accurate knowledge of fiducial colors. It also makes clear that relativistic corrections become increasingly important at greater redshift, in particular for Cepheids observed with the longer-wavelength filters where  and ΔμRLB are both positive. For TRGB-based distances the correction remains just below the 1% when observing in F277W even at 100 Mpc, though it exceeds ±1% in the other three filters considered. The F277W’s greatly reduced sensitivity to extinction and the smallness of K corrections in this filter are particularly useful for future TRGB observations with JWST. For Cepheids, the Wesenheit function – in particular as a combination of JWST filters to benefit from the improved spatial resolution compared to HST/WFC3 – will likely remain important to avoid complications due to reddening, while RLB corrections are straightforward once the LL slope and redshift are known.
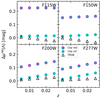 |
Fig. 10. Combined relativistic distance corrections for Cepheids (circles) and the TRGB stars (triangles) observed in four broadband JWST passbands as a function of redshift. Host reddenings of E(B − V) = 0.01 mag and 0.20 mag have been assumed for the TRGB stars and Cepheids, respectively. The filled cyan circles show results for Cepheids after applying corrections for apparent host reddening, whereas the cyan circles with magenta envelopes show Cepheids uncorrected for host extinction. For Cepheids, RLB has been included assuming slopes of −3.2, −3.3, −3.4, and −3.45 mag dex−1 for the F115W, F150W, F200W, and F277W passbands, respectively. |
4.4. K corrections for TRGB distances in the EDD
The recent update of the EDD (Tully et al. 2009; Anand et al. 2021b) contains TRGB distances to more than 500 nearby galaxies observed with HST. The same methodology (henceforth: the EDD TRGB method) was applied by Anand et al. (2021a) to measure H0 using a TRGB-calibrated distance ladder whose systematics differ as much as possible from the systematics of the TRGB distance ladder by Freedman (2021, i.e., the CCHP TRGB method). Key differences among the systematics underlying the EDD and CCHP methods include8 : (a) the EDD’s use of a maximum likelihood fit to a combined RGB/AGB luminosity function (Makarov et al. 2006) instead of the CCHP’s use of a Sobel filter for edge detection; (b) the EDD’s exclusive reliance on HST/ACS F606W observations obtained after the 2009 HST electronics upgrade; (c) the EDD’s absolute calibration using a different field of NGC 4258 and its use as the sole distance ladder anchor; (d) the EDD’s correction for population variance based on a fiducial color calibration (Rizzi et al. 2007; e) the EDD’s homogeneous treatment of reddening corrections based almost exclusively9 on all-sky maps for both the anchor galaxy and the SN-hosts. The following considers the interplay between color corrections and redshift for the EDD TRGB method; further details on the EDD methodology can be found in Makarov et al. (2006), Rizzi et al. (2007), Jacobs et al. (2009), Wu et al. (2014), Anand et al. (2021b).
The EDD method employs the Rizzi et al. (2007) calibration to adapt the absolute F814W magnitude of the TRGB based on observed, de-reddened F606W − F814W color. This color calibration was derived using five nearby galaxies covering a large range in metallicity and in the HST/ACS F814W system yields MF814W = −4.06 + 0.2 ⋅ ((F606W − F814W)−1.23). According to Table 2 in Anand et al. (2021a), there is a 0.049 mag difference between the TRGB color in NGC 4258 and the average SN-host TRGB, with SN-hosts being redder. Hence, the average absolute TRGB F814W magnitude in SN-hosts is 0.01 mag fainter than in NGC 4258. However, this correction does not account for the redshift difference10 between the SN-host average and NGC 4258 of  , which shifts the apparent color of the more distant TRGB stars redward. Using the fiducial TRGB model (cf. Sect. 3.2), we estimate
  to lead to an apparent color change of ∼0.005 mag, which implies a minute overcorrection by ΔμEDD = 0.001 mag based on the Rizzi et al. (2007) calibration. These color-redshift corrections increase linearly with redshift and will need to be included when measuring TRGB distances using the EDD methodology at increasing distances with JWST.
Using our fiducial TRGB star, we find Kext(F814W) = − 0.004 mag applicable to the EDD H0 measurement. Complications due to additional host reddening are minimal because the sole anchor galaxy, NGC 4258, is subject to the same reddening systematics as the EDD SN-hosts (only foreground reddening is corrected using all-sky dust maps). Adopting unaccounted for CGM reddening of E(B − V) = 0.01 mag in both NGC 4258 and the SN-hosts yields a difference in Kext(F814W) of ≪0.001 mag and can be neglected.
4.5. Implications for the Hubble constant
Section 4.3 reported similar combined relativistic corrections for TRGB and Cepheid distances for an average SN-host distance of 20 Mpc. Here, we apply this correction to Eq. (19) to determine the impact of relativistic corrections on published H0 measurements.
For the average redshift of SN-host galaxies used by Riess et al. (2016) and the latest Cepheid-based H0 measurement reported by Riess et al. (2021a, H0 = 73.2 ± 1.3 km s−1 Mpc−1), the total bias  mag11. This implies a previous systematic underestimate of H0 by approximately 0.6% due to the missing K correction, RLB correction, and the change in Wesenheit slope as a function of redshift. This translates to an increase in H0 by +0.45 ± 0.05 km s−1 Mpc−1 to a final bias-corrected value of H0 = 73.65 ± 1.3 km s−1 Mpc−1, where the uncertainty of the correction does not noticeably contribute to the total error budget. The increased H0 value also enhances the discord with respect to the early-Universe H0 value reported by the Planck Collaboration VI (2020, H0 = 67.4 ± 0.5 km s−1 Mpc−1) from 4.2σ to 4.4σ. Additional uncertainty of the correction related to source color – for example, longer-period Cepheids being preferentially detected at greater distances – tends to further increase the numerical value of the correction, thus further increasing H0. We therefore consider this correction based on the fiducial 10 d Cepheid to be a conservative estimate.
For the CCHP TRGB methodology, we obtained a correction of Δμrel(F814W) = 0.011 ± 0.008 mag for an SN-host galaxy redshift of 0.0047 (Freedman et al. 2019). The stated uncertainty corresponds to results spanning the range of E(B − V)host between 0.005 and 0.015 mag. Applying this 0.5% shift to the value of H0 = 69.8 ± 1.7 km s−1 Mpc−1 recently reported by Freedman (2021) increases H0 by 0.36 ± 0.26 km s−1 Mpc−1 to H0 = 70.2 ± 1.7 km s−1 Mpc−1, which differs by 1.6σ from H0 reported by the Planck Collaboration VI (2020).
For the EDD TRGB methodology, we find a combined distance modulus correction of Kext(F814W)+ΔμEDD = −0.004 + 0.001 = −0.003 mag, which translates to a reduction by a mere −0.15% and a reduction of H0 by 0.1 km s−1 Mpc−1 to H0 = 71.4 ± 1.8 km s−1 Mpc−1. As pointed out by Anand et al. (2021a), this value is fully consistent with the Cepheids-based H0 measurement of 72.0 ± 1.9 km s−1 Mpc−1 that assumes the same distance to NGC 4258 for both types of standard candles (Reid et al. 2019). The different systematics concerning host reddening lead to oppositely signed corrections for the CCHP and EDD H0 values and render them consistent to within 1σ.
5. Discussion
5.1. Theoretical versus empirical SEDs
We initially sought to avoid using stellar atmosphere models, and to instead employ empirical SEDs from stellar flux atlases, notably the Pickles stellar flux library (Pickles 1998) and the second data release of the X-shooter spectral library (Gonneau et al. 2020). Unfortunately, the precision afforded by these data sets proved insufficient for our purposes because of several issues including flux calibration, telluric features that do not apply to space-based photometry, reddening of observed SEDs, incomplete or inhomogeneous wavelength coverage (Pickles), cross-calibration across different spectral orders (X-shooter) or even among observations taken from different sites at different times (Pickles), time-dependent variable star SEDs, limited information on spectral types and Teff, reduced ability to test the impact of stellar parameters, and general observational uncertainties, among others.
Of course, the use of stellar atmosphere models represents an obvious limitation to our results, rendering them subject to assumptions and simplifications inherent in the theoretical models. Any systematic errors, for example in temperature scale or in opacity tables, may influence the results presented here, and different atmospheric models may yield somewhat different results. In this context, the present work primarily seeks to provide guidance and a first estimation of the importance of K corrections for SSCs and H0, notably for the TRGB stars and other potential evolved SSCs. However, any systematic offsets due to model assumptions should not invalidate the trends predicted by our analysis, for example, as a function of temperature, redshift, reddening, metallicity, and photometric filters. We therefore believe that the key results of this work are insensitive to model inadequacies, notably regarding the Wesenheit function’s natural mitigation of the magnitude of K corrections, the higher sensitivity of the F814W-based TRGB method to K corrections and missing corrections of host extinction, and the greater consistency of K corrections at longer wavelengths.
5.2. Mira stars and the J-region AGB stars
Short-period (P ≲ 400 d) oxygen-rich Mira stars have been used to measure distances to nearby galaxies (e.g., Whitelock et al. 2008; Yuan et al. 2017; Huang et al. 2018, 2020) and provide a potentially useful alternative to Cepheids or TRGB stars for calibrating SNIa luminosity. Mira stars are typically M giants (Yao et al. 2017) with spectral types varying between M5–M9 (Smith et al. 2002, spectral classifications by Sloan & Price 1998), and the Mira prototype, o Ceti, varies between M5IIIe–M9III (Skiff 2014). The fraction of O- to C-rich Miras depends on metallicity, and most MW Mira stars re O-rich (e.g., Yao et al. 2017).
As dust-rich and cool AGB stars, Miras are clearly outside the parameter space covered by the ATLAS9 models and thus outside the scope of a detailed discussion. Nevertheless, the increasing importance of K corrections with decreasing Teff and increasing host extinction implies that the extinction-dependent K correction will be even more relevant for Mira stars than for Cepheids or TRGB stars. It would be interesting to check if this could be used to empirically constrain K using differences in distance between Mira and Cepheid stars. Localized dust due to stellar mass loss (CSEs) is likely to complicate very accurate host reddening corrections in part due to the poorly known intrinsic color of Mira stars at a given period. The quadratic form of the Mira LL is particularly sensitive to RLB (Anderson 2019). As is the case of Cepheids, the negative LL slope of Miras means that missing RLB corrections lead to systematic underestimates of H0.
Similarly, we could not directly investigate relativistic corrections for the recently introduced JAGB method (Madore & Freedman 2020; Zgirski et al. 2021) since fairly little is currently known about these stars. However, we expect their cool temperatures and likely dusty envelopes to require K corrections more similar to Mira stars than to TRGB stars. Observing these stars with JWST/NIRCAM will have the benefit of smaller K corrections, although Wien’s law increasingly shifts the SED maximum toward the F200W and F277W filters, which may increase sensitivity to extinction and K in analogy with our results for the F814W TRGB method.
5.3. Dust extinction
Dust extinction is the perennial bane of astronomical distance measurements. Aiming toward a 1% H0 measurement, we have explicitly incorporated the effect of dust extinction in non-comoving rest frames in the computation of K corrections. The computed K corrections thus directly depend on the amount of host reddening assumed, and careful consideration of the expected host reddening is required when using the tabulated values of Kext(Λ) in Appendix A.
The Wesenheit function (cf. Sect. 4.3) offers an easy-to-employ and robust opportunity for avoiding most of the difficulties related to host reddening while simultaneously reducing the LL’s intrinsic scatter (e.g., Macri et al. 2015; Anderson et al. 2016). Additionally, we found here that K corrections computed using the optical-NIR Wesenheit function exhibit only a marginal redshift dependence thanks to the function’s advantageous combination of passbands exhibiting opposite trends with redshift. Given these substantial benefits of the Wesenheit function, it appears judicious to also apply the Wesenheit function to TRGB distance measurements, although obtaining sufficiently precise observational material in multiple passbands represents a practical difficulty. A combination of optical and NIR filters would be particularly well suited to this effect to sample both sides of TRGB star peak flux.
As discussed by Mortsell et al. (2021), the assumption of a particular reddening law normalized to a fixed value of RV remains a clear limitation of the Wesenheit formalism. Line-of-sight variations in RV contribute uncertainty when considering individual objects. However, the distance ladder probes hundreds of lines of sight among its calibrators located in multiple different anchor galaxies, as well as thousands of lines of sight among standard candles in SN-host galaxies (Riess et al. 2021a; Freedman 2021). Hence, we expect line-of-sight variations in RV to primarily contribute scatter to observed Wesenheit PL-distributions in anchor and host galaxies alike, rather than a systematic difference between anchor galaxies and SN-hosts.
That said, cosmic expansion does affect the apparent reddening of sources systematically as a function of redshift (McCall 2004). However, this effect is on the order of a few millimagnitudes for the NIR Wesenheit function applied to distances shorter than 100 Mpc (cf. Eq. (13)). The corresponding bias correction tends to increase the value of H0.
Another intriguing complication is the interplay of dust extinction with heterochromatic magnitudes measured in broadband filters. As discussed in Sect. 2.2, the value of RW in the Wesenheit function depends on the filter combination used, the adopted reddening law and its normalization RV, and source SED. This effect of source SED on RW is relevant for the determination of H0 (cf. the analysis variants in Riess et al. 2016). However, it is of only secondary importance to our computed K corrections as long as RV and source SED are identical in the respective rest frames.
In summary, the Wesenheit function offers a straightforward and robust way to avoid significant issues related to dust extinction without explicitly correcting for reddening by measuring color excesses relative to somewhat uncertain fiducial colors. The selection of low-reddening Cepheids for LL calibration (Riess et al. 2018, 2021a) and low-reddening, nearly face-on SN-host galaxies Riess et al. (2016) for their application, as well as using color and amplitude cuts for Cepheids in SN-hosts further limits the impact of any possible negative side effects related to reddening. Currently missing host extinction corrections introduce a small (and uncertain) bias for F814W-based TRGB distances. As explained in Sect. 3.2, two sources of extinction could contribute. Extinction by gas or dust in galaxy halos is mostly avoided by observing the TRGB far from the disk (Jang et al. 2021). Extinction due to CSEs has not yet been adequately quantified so that its impact on TRGB distances remains an open question. In particular JWST’s longer-wavelength filters will reduce sensitivity to dust absorption, but may also increase sensitivity to warm circumstellar material. This, of course, also applies to Cepheids, where CSEs have been reported in several studies (e.g., Kervella et al. 2009; Gallenne et al. 2013; Schmidt 2015) and increasingly contribute flux at wavelengths longer than approximately the H band (e.g., Hocdé et al. 2020; Groenewegen 2020).
6. Conclusions
We have investigated relativistic corrections for cosmic distances measured using SSCs, such as classical Cepheids and stars near the TRGB. Our analysis focused on redshifts z < 0.03 to aid the accurate calibration of the SNIa luminosity zero point as required for measuring H0 to within 1%. Three relativistic effects have been considered: K corrections, time dilation, and the difference of dust extinction across non-comoving reference frames. To this end, we incorporated extinction explicitly in the definition of the K correction.
K corrections for the NIR Wesenheit function applied to Cepheids slightly increase the value of H0 previously reported by the SH0ES team (Riess et al. 2016, 2018, 2021a) and are relatively insensitive to redshift. Redshift-Leavitt bias corrections (Anderson 2019) dominate over Kext(WH, VI) and are easily applied using the slope of the period-luminosity relation and redshift measurements of SN-host galaxies. The effect of redshift on the RW term for the Wesenheit function is very small (< 3 mmag). All three effects tend to increase the value of H0.
The combined K, RLB, and Wesenheit slope correction increases the SH0ES value of H0 by 0.45 ± 0.05 km s−1 Mpc−1 to  km s−1 Mpc−1, enhancing the tension with the value for the early Universe reported by the Planck Collaboration VI (2020) from 4.2σ to 4.4σ. Larger corrections will apply as the average distance of SN-host galaxies is pushed farther in an effort to obtain larger samples of SN-host galaxies for better H0 precision.
K corrections for TRGB-based distances depend on the amount of localized host extinction. For little to no host reddening (E(B − V)host ≲ 0.004 mag), K(F814W) < 0 for the TRGB fiducial SED considered. Reddening due to the CGM equivalent to E(B − V)host ≈ 0.01 mag yields an upward correction of the TRGB-based H0 measurement reported by Freedman (2021) by ∼0.5% to  km s−1 Mpc−1. We identified reddening due to circumstellar material lost during RGB evolution as a potential additional contributor to host extinction, although it is unlikely to explain the difference between Cepheid and TRGB-based H0 measurements. The impact of mass loss on TRGB distance measurements remains an open question, and further research is required to understand its magnitude and relevance, in particular for longer-wavelength JWST observations.
On the other hand, we estimate a combined correction of −0.1 km s−1 Mpc−1 applicable to the recent H0 measurement by Anand et al. (2021a) when taking into account both the K correction and the effect of redshift on the observed color used to correct population variations in the TRGB absolute magnitude. Thus, the TRGB methodology employed by the EDD (Anand et al. 2021b) yields a corrected value of  km s−1 Mpc−1, consistent to within 1σ with both
  and
and  .
.
K corrections are required to measure H0 to 1% using all types of standard candles and using most photometric filters. Interestingly, K corrections become increasingly independent of Teff at wavelengths up to approximately 2 μm and exhibit the weakest Teff dependence in the JWST F200W filter. Nevertheless, F200W K corrections for SSCs observed at Coma cluster distances (100 Mpc) exceed 0.02 mag (1% in distance) for all temperatures considered. For TRGB stars, JWST’s F277W filter yields consistently small K corrections that do not exceed 1%, even at 100 Mpc. New Wesenheit functions formulated for a combination of shorter-wavelength HST and longer-wavelength JWST passbands could be designed to optimally reduce the combined effects of reddening and K corrections on distance measurements.
File alpha_lyr_stis_008.fits, available at https://ssb.stsci.edu/cdbs/calspec/
While some of these differences, such as photometric homogeneity, are clear advantages of the EDD methodology over that adopted by the CCHP, the effect of other differences remains contentious, such as the benefit of relying on a single anchor galaxy with homogeneous photometry (EDD) versus averaging over multiple hosts with inhomogeneous photometry (CCHP), or the equivalence of TRGB populations in anchor and SN-host galaxies. Certainly, the detailed analysis of these differences and their relative importance for measuring H0 is beyond the scope of this article. Interested readers are referred to the original EDD and CCHP articles for further detail.
The sole exception being the SN-host galaxy NGC 5643 whose low Galactic latitude renders all-sky reddening maps unreliable.
Computed using the difference in heliocentric redshifts tabulated by NED, with the exception of NGC 1441, where we used the average of the Fornax cluster from Madore et al. (1999).
The uncertainty on the correction is based on varying the amount of host reddening by ±0.1 mag around the adopted typical 0.20 mag.
Acknowledgments
I am grateful to Antoine Mérand, Rolf-Peter Kudritzki, Laurent Eyer, Jason Spyromilio, and Bruno Leibundgut for inspiring and useful discussions. Comments by the anonymous referee resulted in an improved manuscript, in particular regarding the discussion of host reddening and TRGB distances. I also thank the ORIGINS excellence cluster and the Universitätssternwarte of the Ludwig-Maximilians-Universität München, Germany, for hosting me as a long-term visitor during uncertain times related to the COVID-19 pandemic in 2020. This research has made use of the SVO Filter Profile Service (http://svo2.cab.inta-csic.es/theory/fps/) supported from the Spanish MINECO through grant AYA2017-84089 and the NASA/IPAC Extragalactic Database (NED), which is operated by the Jet Propulsion Laboratory, California Institute of Technology, under contract with the National Aeronautics and Space Administration. The following software made this research possible: Pysynphot, astropy (Astropy Collaboration 2013, 2018), ipython (Perez & Granger 2007), numpy (Harris et al. 2020), matplotlib (Hunter 2007), and scipy (Virtanen et al. 2020). This project has received funding from the European Research Council (ERC) under the European Union’s Horizon 2020 research and innovation programme (Grant Agreement No. 947660). RIA acknowledges funding provided by an SNSF Eccellenza Professorial Fellowship (Grant No. PCEFP2_194638).
Note added in proof. While this paper was in press, the SH0ES+Pantheon teams (Riess et al. 2021b) provided an updated measurement of H0 based on a combined Cepheids & TRGB plus SN Ia distance ladder that includes a correction for the largest effect described here, that is, the dilation of Cepheid periods.
References
- Anand, G. S., Tully, R. B., Rizzi, L., Riess, A. G., & Yuan, W. 2021a, AAS J. submitted [arXiv:2108.00007] [Google Scholar]
- Anand, G. S., Rizzi, L., Tully, R. B., et al. 2021b, AJ, 162, 80 [CrossRef] [Google Scholar]
- Anand, A., Nelson, D., & Kauffmann, G. 2021c, MNRAS, 504, 65 [NASA ADS] [CrossRef] [Google Scholar]
- Anderson, R. I. 2019, A&A, 631, A165 [NASA ADS] [CrossRef] [EDP Sciences] [Google Scholar]
- Anderson, R. I., & Riess, A. G. 2018, ApJ, 861, 36 [NASA ADS] [CrossRef] [Google Scholar]
- Anderson, R. I., Saio, H., Ekström, S., Georgy, C., & Meynet, G. 2016, A&A, 591, A8 [NASA ADS] [CrossRef] [EDP Sciences] [Google Scholar]
- Astropy Collaboration (Robitaille, T. P., et al.) 2013, A&A, 558, A33 [NASA ADS] [CrossRef] [EDP Sciences] [Google Scholar]
- Astropy Collaboration (Price-Whelan, A. M., et al.) 2018, AJ, 156, 123 [Google Scholar]
- Bressan, A., Marigo, P., Girardi, L., et al. 2012, MNRAS, 427, 127 [NASA ADS] [CrossRef] [Google Scholar]
- Breuval, L., Kervella, P., Anderson, R. I., et al. 2020, A&A, 643, A115 [EDP Sciences] [Google Scholar]
- Breuval, L., Kervella, P., Wielgórski, P., et al. 2021, ApJ, 913, 38 [NASA ADS] [CrossRef] [Google Scholar]
- Calcino, J., & Davis, T. 2017, JCAP, 1, 038 [Google Scholar]
- Cardelli, J. A., Clayton, G. C., & Mathis, J. S. 1989, ApJ, 345, 245 [Google Scholar]
- Cassisi, S. 2017, Eur. Phys. J. Web Conf., 160, 04002 [Google Scholar]
- Castelli, F., & Kurucz, R. L. 2003, in Modelling of Stellar Atmospheres, eds. N. Piskunov, W. W. Weiss, & D. F. Gray, 210, A20 [Google Scholar]
- Cerny, W., Freedman, W. L., Madore, B. F., et al. 2020, AAS J., submitted [arXiv:2012.09701] [Google Scholar]
- Chen, Y., Girardi, L., Fu, X., et al. 2019, A&A, 632, A105 [EDP Sciences] [Google Scholar]
- Cortés, C., Silva, J. R. P., Recio-Blanco, A., et al. 2009, ApJ, 704, 750 [CrossRef] [Google Scholar]
- Cranmer, S. R., & Saar, S. H. 2011, ApJ, 741, 54 [Google Scholar]
- Di Valentino, E., Mena, O., Pan, S., et al. 2021, Class. Quant. Grav., 38, 153001 [NASA ADS] [CrossRef] [Google Scholar]
- Dupree, A. K., Smith, G. H., & Strader, J. 2009, AJ, 138, 1485 [NASA ADS] [CrossRef] [Google Scholar]
- Efstathiou, G. 2020, ArXiv e-prints [arXiv:2007.10716] [Google Scholar]
- Ekström, S., Georgy, C., Eggenberger, P., et al. 2012, A&A, 537, A146 [Google Scholar]
- Fitzpatrick, E. L. 1999, PASP, 111, 63 [Google Scholar]
- Freedman, W. L. 2021, ApJ, 919, 16 [NASA ADS] [CrossRef] [Google Scholar]
- Freedman, W. L., Madore, B. F., Hatt, D., et al. 2019, ApJ, 882, 34 [Google Scholar]
- Freedman, W. L., Madore, B. F., Hoyt, T., et al. 2020, ApJ, 891, 57 [Google Scholar]
- Gallenne, A., Mérand, A., Kervella, P., et al. 2013, A&A, 558, A140 [NASA ADS] [CrossRef] [EDP Sciences] [Google Scholar]
- Georgy, C., Ekström, S., Granada, A., et al. 2013, A&A, 553, A24 [NASA ADS] [CrossRef] [EDP Sciences] [Google Scholar]
- Gieren, W., Storm, J., Konorski, P., et al. 2018, A&A, 620, A99 [NASA ADS] [CrossRef] [EDP Sciences] [Google Scholar]
- Gonneau, A., Lyubenova, M., Lançon, A., et al. 2020, A&A, 634, A133 [NASA ADS] [CrossRef] [EDP Sciences] [Google Scholar]
- Górski, M., Zgirski, B., Pietrzyński, G., et al. 2020, ApJ, 889, 179 [Google Scholar]
- Gratton, R. G., Carretta, E., Bragaglia, A., Lucatello, S., & D’Orazi, V. 2010, A&A, 517, A81 [CrossRef] [EDP Sciences] [Google Scholar]
- Groenewegen, M. A. T. 2012, A&A, 540, A32 [NASA ADS] [CrossRef] [EDP Sciences] [Google Scholar]
- Groenewegen, M. A. T. 2018, A&A, 619, A8 [NASA ADS] [CrossRef] [EDP Sciences] [Google Scholar]
- Groenewegen, M. A. T. 2020, A&A, 635, A33 [EDP Sciences] [Google Scholar]
- Groenewegen, M. A. T. 2021, A&A, 654, A20 [NASA ADS] [CrossRef] [EDP Sciences] [Google Scholar]
- Hamuy, M., Phillips, M. M., Wells, L. A., & Maza, J. 1993, PASP, 105, 787 [NASA ADS] [CrossRef] [Google Scholar]
- Harris, W. E. 1996, AJ, 112, 1487 [Google Scholar]
- Harris, C. R., Millman, K. J., van der Walt, S. J., et al. 2020, Nature, 585, 357 [NASA ADS] [CrossRef] [Google Scholar]
- Hocdé, V., Nardetto, N., Lagadec, E., et al. 2020, A&A, 633, A47 [NASA ADS] [CrossRef] [EDP Sciences] [Google Scholar]
- Hogg, D. W., Baldry, I. K., Blanton, M. R., & Eisenstein, D. J. 2002, ArXiv e-prints [arXiv:astro-ph/0210394] [Google Scholar]
- Hoyt, T. J. 2021, ArXiv e-prints [arXiv:2106.13337] [Google Scholar]
- Huang, C. D., Riess, A. G., Hoffmann, S. L., et al. 2018, ApJ, 857, 67 [NASA ADS] [CrossRef] [Google Scholar]
- Huang, C. D., Riess, A. G., Yuan, W., et al. 2020, ApJ, 889, 5 [Google Scholar]
- Hubble, E. 1936, ApJ, 84, 517 [NASA ADS] [CrossRef] [Google Scholar]
- Huchra, J. P., Geller, M. J., Clemens, C. M., Tokarz, S. P., & Michel, A. 1992, Bulletin d’Information du Centre de Données Stellaires, 41, 31 [Google Scholar]
- Humason, M. L., Mayall, N. U., & Sandage, A. R. 1956, AJ, 61, 97 [CrossRef] [Google Scholar]
- Hunter, J. D. 2007, Comput. Sci. Eng., 9, 90 [NASA ADS] [CrossRef] [Google Scholar]
- Jacobs, B. A., Rizzi, L., Tully, R. B., et al. 2009, AJ, 138, 332 [NASA ADS] [CrossRef] [Google Scholar]
- Jang, I. S., & Lee, M. G. 2017, ApJ, 836, 74 [NASA ADS] [CrossRef] [Google Scholar]
- Jang, I. S., Hoyt, T. J., Beaton, R. L., et al. 2021, ApJ, 906, 125 [NASA ADS] [CrossRef] [Google Scholar]
- Javanmardi, B., Mérand, A., Kervella, P., et al. 2021, ApJ, 911, 12 [Google Scholar]
- Kervella, P., Mérand, A., & Gallenne, A. 2009, A&A, 498, 425 [NASA ADS] [CrossRef] [EDP Sciences] [Google Scholar]
- Kim, A., Goobar, A., & Perlmutter, S. 1996, PASP, 108, 190 [NASA ADS] [CrossRef] [Google Scholar]
- Kovtyukh, V. V., Andrievsky, S. M., Belik, S. I., & Luck, R. E. 2005, AJ, 129, 433 [Google Scholar]
- Kudritzki, R.-P., Urbaneja, M. A., Gazak, Z., et al. 2013, ApJ, 779, L20 [NASA ADS] [CrossRef] [Google Scholar]
- Leavitt, H. S., & Pickering, E. C. 1912, Harv. Coll. Obs. Circ., 173, 1 [Google Scholar]
- Lee, M. G., Freedman, W. L., & Madore, B. F. 1993, ApJ, 417, 553 [Google Scholar]
- Lemasle, B., de Boer, T. J. L., Hill, V., et al. 2014, A&A, 572, A88 [NASA ADS] [CrossRef] [EDP Sciences] [Google Scholar]
- Macri, L. M., Ngeow, C.-C., Kanbur, S. M., Mahzooni, S., & Smitka, M. T. 2015, AJ, 149, 117 [Google Scholar]
- Madore, B. F. 1976, The Galaxy and the Local Group (Greenwich: Royal Greenwich Observatory), 182, 153 [NASA ADS] [Google Scholar]
- Madore, B. F. 1982, ApJ, 253, 575 [NASA ADS] [CrossRef] [Google Scholar]
- Madore, B. F., & Freedman, W. L. 2020, ApJ, 899, 66 [NASA ADS] [CrossRef] [Google Scholar]
- Madore, B. F., Freedman, W. L., Silbermann, N., et al. 1999, ApJ, 515, 29 [NASA ADS] [CrossRef] [Google Scholar]
- Madore, B. F., Freedman, W. L., & Moak, S. 2017, ApJ, 842, 42 [NASA ADS] [CrossRef] [Google Scholar]
- Makarov, D., Makarova, L., Rizzi, L., et al. 2006, AJ, 132, 2729 [NASA ADS] [CrossRef] [Google Scholar]
- McCall, M. L. 2004, AJ, 128, 2144 [Google Scholar]
- McDonald, I., & Zijlstra, A. A. 2015, MNRAS, 448, 502 [Google Scholar]
- McDonald, I., Johnson, C. I., & Zijlstra, A. A. 2011a, MNRAS, 416, L6 [NASA ADS] [CrossRef] [Google Scholar]
- McDonald, I., Boyer, M. L., van Loon, J. T., et al. 2011b, ApJS, 193, 23 [NASA ADS] [CrossRef] [Google Scholar]
- McQuinn, K. B. W., Boyer, M., Skillman, E. D., & Dolphin, A. E. 2019, ApJ, 880, 63 [Google Scholar]
- Ménard, B., Scranton, R., Fukugita, M., & Richards, G. 2010, MNRAS, 405, 1025 [NASA ADS] [Google Scholar]
- Miglio, A., Brogaard, K., Stello, D., et al. 2012, MNRAS, 419, 2077 [Google Scholar]
- Mortsell, E., Goobar, A., Johansson, J., & Dhawan, S. 2021, ArXiv e-prints [arXiv:2105.11461] [Google Scholar]
- Nataf, D. M., Cassisi, S., Casagrande, L., Yuan, W., & Riess, A. G. 2021, ApJ, 910, 121 [NASA ADS] [CrossRef] [Google Scholar]
- Nugent, P., Kim, A., & Perlmutter, S. 2002, PASP, 114, 803 [NASA ADS] [CrossRef] [Google Scholar]
- Oke, J. B., & Sandage, A. 1968, ApJ, 154, 21 [NASA ADS] [CrossRef] [Google Scholar]
- Pasquato, M., de Luca, A., Raimondo, G., et al. 2014, ApJ, 789, 28 [NASA ADS] [CrossRef] [Google Scholar]
- Peek, J. E. G., Ménard, B., & Corrales, L. 2015, ApJ, 813, 7 [NASA ADS] [CrossRef] [Google Scholar]
- Perez, F., & Granger, B. E. 2007, Comput. Sci. Eng., 9, 21 [Google Scholar]
- Pickles, A. J. 1998, PASP, 110, 863 [NASA ADS] [CrossRef] [Google Scholar]
- Planck Collaboration VI. 2020, A&A, 641, A6 [NASA ADS] [CrossRef] [EDP Sciences] [Google Scholar]
- Proxauf, B., da Silva, R., Kovtyukh, V. V., et al. 2018, A&A, 616, A82 [NASA ADS] [CrossRef] [EDP Sciences] [Google Scholar]
- Putman, M. E., Peek, J. E. G., & Joung, M. R. 2012, ARA&A, 50, 491 [Google Scholar]
- Reed, B. C., Hesser, J. E., & Shawl, S. J. 1988, PASP, 100, 545 [Google Scholar]
- Reid, M. J., Pesce, D. W., & Riess, A. G. 2019, ApJ, 886, L27 [Google Scholar]
- Reimers, D. 1975, Mem. Soc. R. Sci. Liege, 8, 369 [NASA ADS] [Google Scholar]
- Riess, A. G. 2020, Nat. Rev. Phys., 2, 10 [NASA ADS] [CrossRef] [Google Scholar]
- Riess, A. G., Macri, L. M., Hoffmann, S. L., et al. 2016, ApJ, 826, 56 [Google Scholar]
- Riess, A. G., Casertano, S., Yuan, W., et al. 2018, ApJ, 861, 126 [NASA ADS] [CrossRef] [Google Scholar]
- Riess, A. G., Casertano, S., Yuan, W., Macri, L. M., & Scolnic, D. 2019, ApJ, 876, 85 [Google Scholar]
- Riess, A. G., Yuan, W., Casertano, S., Macri, L. M., & Scolnic, D. 2020, ApJ, 896, L43 [Google Scholar]
- Riess, A. G., Casertano, S., Yuan, W., et al. 2021a, ApJ, 908, L6 [NASA ADS] [CrossRef] [Google Scholar]
- Riess, A. G., Yuan, W., Macri, L. M., et al. 2021b, ArXiv e-prints [arXiv:2112.04510] [Google Scholar]
- Rizzi, L., Tully, R. B., Makarov, D., et al. 2007, ApJ, 661, 815 [Google Scholar]
- Salaris, M., & Cassisi, S. 1997, MNRAS, 289, 406 [NASA ADS] [Google Scholar]
- Salaris, M., Cassisi, S., & Pietrinferni, A. 2016, A&A, 590, A64 [CrossRef] [EDP Sciences] [Google Scholar]
- Sandage, A. R., Kron, R. G., & Longair, M. S. 1995, in The Deep Universe, Saas-Fee Advanced Course 23. Lecture Notes 1993, eds. B. Binggeli, & R. Buser (Berlin: Springer) [Google Scholar]
- Schlafly, E. F., & Finkbeiner, D. P. 2011, ApJ, 737, 103 [Google Scholar]
- Schlegel, D. J., Finkbeiner, D. P., & Davis, M. 1998, ApJ, 500, 525 [Google Scholar]
- Schmidt, E. G. 2015, ApJ, 813, 29 [Google Scholar]
- Schröder, K. P., & Cuntz, M. 2005, ApJ, 630, L73 [CrossRef] [Google Scholar]
- Serenelli, A., Weiss, A., Cassisi, S., Salaris, M., & Pietrinferni, A. 2017, A&A, 606, A33 [NASA ADS] [CrossRef] [EDP Sciences] [Google Scholar]
- Skiff, B. A. 2014, VizieR Online Data Catalog: B/mk [Google Scholar]
- Skowron, D. M., Skowron, J., Udalski, A., et al. 2021, ApJS, 252, 23 [Google Scholar]
- Sloan, G. C., & Price, S. D. 1998, ApJS, 119, 141 [NASA ADS] [CrossRef] [Google Scholar]
- Smith, B. J., Leisawitz, D., Castelaz, M. W., & Luttermoser, D. 2002, AJ, 123, 948 [NASA ADS] [CrossRef] [Google Scholar]
- Soltis, J., Casertano, S., & Riess, A. G. 2021, ApJ, 908, L5 [Google Scholar]
- STScI Development Team 1975, Astrophysics Source Code Library [record ascl:1303.023] [Google Scholar]
- Suyu, S. H., Treu, T., Blandford, R. D., et al. 2012, ArXiv e-prints [arXiv:1202.4459] [Google Scholar]
- Tailo, M., Milone, A. P., Lagioia, E. P., et al. 2021, MNRAS, 503, 694 [NASA ADS] [CrossRef] [Google Scholar]
- Tully, R. B., Rizzi, L., Shaya, E. J., et al. 2009, AJ, 138, 323 [NASA ADS] [CrossRef] [Google Scholar]
- Tully, R. B., Courtois, H. M., Dolphin, A. E., et al. 2013, AJ, 146, 86 [NASA ADS] [CrossRef] [Google Scholar]
- Tumlinson, J., Peeples, M. S., & Werk, J. K. 2017, ARA&A, 55, 389 [Google Scholar]
- Valenti, E., Ferraro, F. R., & Origlia, L. 2004, MNRAS, 354, 815 [NASA ADS] [CrossRef] [Google Scholar]
- van den Bergh, S. 1975, in Galaxies and the Universe, eds. A. Sandage, M. Sandage, & J. Kristian (Chicago: University of Chicago Press), 509 [Google Scholar]
- Verde, L., Treu, T., & Riess, A. G. 2019, Nat. Astron., 3, 891 [Google Scholar]
- Virtanen, P., Gommers, R., Oliphant, T. E., et al. 2020, Nat. Meth., 17, 261 [Google Scholar]
- Webbink, R. F. 1985, in Dynamics of Star Clusters, eds. J. Goodman, & P. Hut, 113, 541 [Google Scholar]
- Weinberg, D. H., Mortonson, M. J., Eisenstein, D. J., et al. 2013, Phys. Rep., 530, 87 [Google Scholar]
- Whitelock, P. A., Feast, M. W., & Van Leeuwen, F. 2008, MNRAS, 386, 313 [CrossRef] [Google Scholar]
- Wu, P.-F., Tully, R. B., Rizzi, L., et al. 2014, AJ, 148, 7 [NASA ADS] [CrossRef] [Google Scholar]
- Yao, Y., Liu, C., Deng, L., de Grijs, R., & Matsunaga, N. 2017, ApJS, 232, 16 [NASA ADS] [CrossRef] [Google Scholar]
- Yuan, W., Macri, L. M., He, S., et al. 2017, AJ, 154, 149 [NASA ADS] [CrossRef] [Google Scholar]
- Zaritsky, D. 1994, AJ, 108, 1619 [NASA ADS] [CrossRef] [Google Scholar]
- Zgirski, B., Pietrzyński, G., Gieren, W., et al. 2021, ApJ, submitted [arXiv:2105.02120] [Google Scholar]
- Zinn, R. 1985, ApJ, 293, 424 [Google Scholar]
Appendix A: Information provided in machine-readable tables
This appendix presents a subset of the information made available as machine-readable tables via the Centre de Données de Strasbourg for reference. Table A.1 illustrates the information available for the model grid computation, assuming that absolute calibration accounts for extinction and that foreground reddening corrections are also applied (i.e., E(B − V)cal = E(B − V)fg = 0). Table A.2 lists the three corrective terms, Kext(WH, VI), RLB, and ΔμRW for the fiducial Cepheid observed using the optical-NIR Wesenheit function (Eq. 11). Table A.3 lists results for stars near the TRGB for a finely sampled, narrow range of host reddening values.
K corrections as a function of stellar parameters, redshift, and reddening.
Relativistic corrections for fiducial 10 d Cepheids observed using Wesenheit magnitudes.
K corrections for TRGB stars.
All Tables
Relativistic corrections for fiducial 10 d Cepheids observed using Wesenheit magnitudes.
All Figures
|
Fig. 1. Cartoon illustration of the applied methodology. Center: source progressively reddened and attenuated by dust, redshift, and distance. Right: host extinction, redshift, and foreground extinction successively applied to ATLAS9 SEDs before a synthetic photometry in the observer frame is performed to compute the “observed” SED used to compute the K correction and the apparent extinction correction based on apparent color excess. The dotted vertical lines indicate the position of the wavelength of the Ca II IR triplet in the emitter frame. Left: distance, DL, determined using observed apparent magnitude, mo, the observer-frame calibrated absolute magnitude, Mcal, the dust extinction corrections based on apparent color excess (E(B − V)), and estimates of foreground dust extinction (Afg). Image credit for M100 and HST: NASA/STScI. |
| In the text | |
|
Fig. 2. Dependence of log P on Teff determined based on the pulsation analysis of Geneva stellar evolution models for solar metallicity for Cepheids with typical initial rotation (ω = 0.5) (Anderson et al. 2016). The blue dash-dotted line represents the midpoint between the hot and cool edges of the IS, and we average over the second crossing. |
| In the text | |
|
Fig. 3. K corrections as a function of redshift, z, and Teff for different filters of interest for the simplified case without extinction. Circles show results for Teff ∈ [3500, 6000] K (from red to blue circles; cf. the color bar below), with fixed log g = 1.5 and [Fe/H] = 0.0. The fiducial 10 d MW Cepheid analog is shown by thick solid lines. Results for the fiducial TRGB star ([Fe/H] = −1.75) are shown as thick dashed black lines. |
| In the text | |
|
Fig. 4. K corrections divided by redshift, z, as a function of filter reference wavelength for stars of different temperatures (same scale as in Fig. 3) for the simplified case without extinction. The fiducial 10 d MW Cepheid analog is shown as a thick black solid line, and the fiducial TRGB star as a thick dashed black line. K corrections in the JWST/NIRCAM F200W and 2MASS Ks filters are particularly insensitive to temperature differences. K corrections become increasingly positive and less filter-sensitive with wavelength. |
| In the text | |
|
Fig. 5. Illustration of extinction-dependent reduced K corrections as a function of redshift for a 10 d Cepheid listed in Table 1 and stars near the TRGB listed in Table 3. The results shown assume host reddening of 0.20 mag and 0.00 mag for Cepheids and TRGB stars, respectively. For Cepheids, |
| In the text | |
|
Fig. 6. K corrections for Cepheids as a function of log P for different metallicities, computed assuming a redshift difference of 0.0056 (∼23 Mpc) for several filters and assuming no extinction. Line styles identify the adopted metallicity of the MW (solid lines), the LMC (dashed lines), and the SMC (dash-dotted lines). |
| In the text | |
|
Fig. 7. Wesenheit K corrections for an X Cyg-like Cepheid (16.4 d) at 23 Mpc as a function of phase (by proxy of Teff) and assuming different amounts of host reddening. The most significant phase variation is seen for the highest amount of reddening, where Kext(WH, VI) may differ by as much as 0.01 mag among phases of extreme Teff values. |
| In the text | |
|
Fig. 8. Spectral energy distribution incident on HST/WFC3 filters F555W (yellow) and F814W (black) for a typical TRGB star (left) and a 10-day Cepheid (right). Un-reddened spectra at rest are plotted in dark blue and the un-reddened spectra at z = 0.025 in cyan. Spectra reddened by E(B − V) = 0.10 mag are shown at rest (red) and at z = 0.025 (magenta) for illustration purposes. The sensitivity of stars near the TRGB observed in F814W to even light reddening and small redshift is readily apparent and mirrors that of 10 d Cepheids observed in F555W. |
| In the text | |
|
Fig. 9. Distance modulus bias at 20 Mpc as a function of host reddening for Cepheids observed using the optical-NIR Wesenheit function (left) and the TRGB calibrated in the F814W filter (right). Symbols show stars of different temperature, for Cepheids corresponding to pulsation periods of 5, 10, and 60 d (cyan, yellow, and magenta circles, respectively) and for TRGB stars for fiducial Teff of 4100, 4200, and 4300 K (magenta, yellow, and cyan downward triangles). The solid horizontal line for Cepheids indicates the K correction alone for host reddening corresponding to E(B − V) = 0.20 mag. The dashed horizontal lines illustrate the preferred corrections; for Cepheids, this includes corrections for RLB and the redshifted reddening law, for TRGB stars a halo extinction of E(B − V) = 0.01 mag. The solid black circle in the right panel illustrates the amount of host reddening at which Cepheid and TRGB-based H0 measurements would become consistent to within their joint 1σ uncertainty. The ordinate of this point is the sum of the 0.012 mag correction applicable to Cepheids and the current 0.065 mag shift required to render both (uncorrected) H0 measurements consistent with each other to within 1σ. |
| In the text | |
|
Fig. 10. Combined relativistic distance corrections for Cepheids (circles) and the TRGB stars (triangles) observed in four broadband JWST passbands as a function of redshift. Host reddenings of E(B − V) = 0.01 mag and 0.20 mag have been assumed for the TRGB stars and Cepheids, respectively. The filled cyan circles show results for Cepheids after applying corrections for apparent host reddening, whereas the cyan circles with magenta envelopes show Cepheids uncorrected for host extinction. For Cepheids, RLB has been included assuming slopes of −3.2, −3.3, −3.4, and −3.45 mag dex−1 for the F115W, F150W, F200W, and F277W passbands, respectively. |
| In the text | |
Current usage metrics show cumulative count of Article Views (full-text article views including HTML views, PDF and ePub downloads, according to the available data) and Abstracts Views on Vision4Press platform.
Data correspond to usage on the plateform after 2015. The current usage metrics is available 48-96 hours after online publication and is updated daily on week days.
Initial download of the metrics may take a while.