Fig. 1.
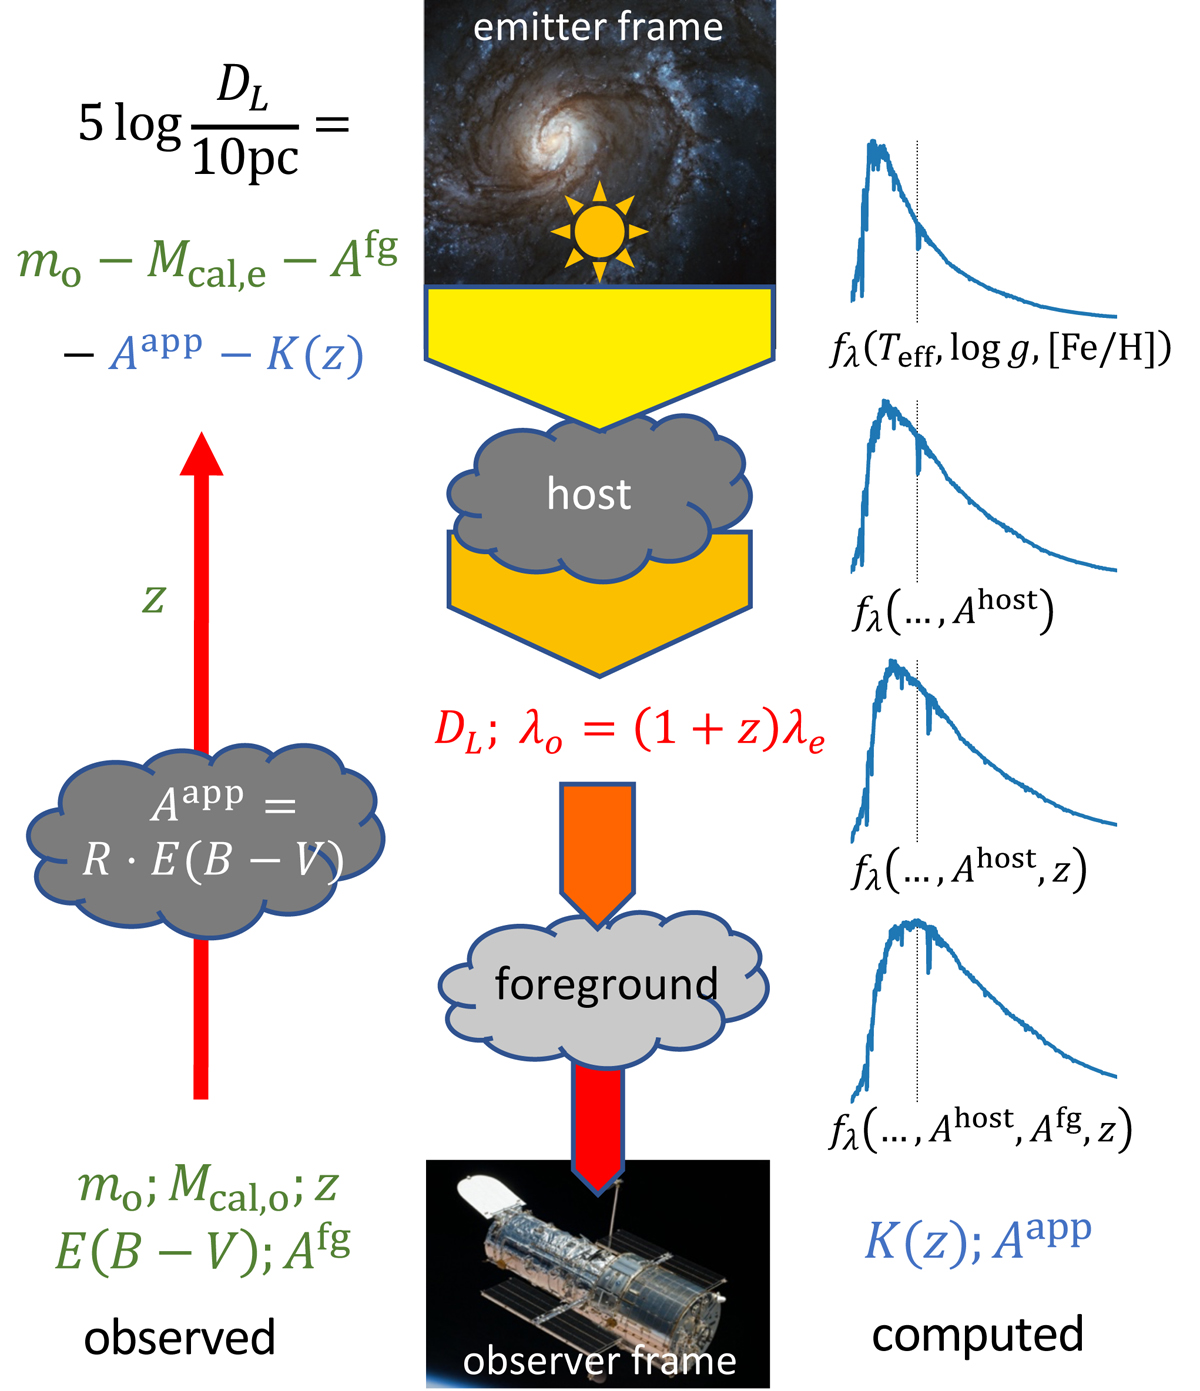
Download original image
Cartoon illustration of the applied methodology. Center: source progressively reddened and attenuated by dust, redshift, and distance. Right: host extinction, redshift, and foreground extinction successively applied to ATLAS9 SEDs before a synthetic photometry in the observer frame is performed to compute the “observed” SED used to compute the K correction and the apparent extinction correction based on apparent color excess. The dotted vertical lines indicate the position of the wavelength of the Ca II IR triplet in the emitter frame. Left: distance, DL, determined using observed apparent magnitude, mo, the observer-frame calibrated absolute magnitude, Mcal, the dust extinction corrections based on apparent color excess (E(B − V)), and estimates of foreground dust extinction (Afg). Image credit for M100 and HST: NASA/STScI.
Current usage metrics show cumulative count of Article Views (full-text article views including HTML views, PDF and ePub downloads, according to the available data) and Abstracts Views on Vision4Press platform.
Data correspond to usage on the plateform after 2015. The current usage metrics is available 48-96 hours after online publication and is updated daily on week days.
Initial download of the metrics may take a while.