| Issue |
A&A
Volume 658, February 2022
|
|
|---|---|---|
| Article Number | A25 | |
| Number of page(s) | 18 | |
| Section | Extragalactic astronomy | |
| DOI | https://doi.org/10.1051/0004-6361/202141565 | |
| Published online | 27 January 2022 | |
H I mapping of the Leo Triplet
Morphologies and kinematics of tails and bridges
1
Max-Planck-Institut für Radioastronomie, Auf dem Hügel 69, 53121 Bonn, Germany
e-mail: This email address is being protected from spambots. You need JavaScript enabled to view it.
2
Xinjiang Astronomical Observatory, Chinese Academy of Sciences, 830011 Urumqi, Xinjiang, PR China
3
Instituto de Astrofísica de Andalucía, CSIC, 18080 Granada, Spain
4
Astronomy Department, King Abdulaziz University, PO Box 80203 Jeddah 21589, Saudi Arabia
5
Helmholtz-Institut für Strahlen und Kernphysik (HISKP), University of Bonn, Nussallee 14-16, 53115 Bonn, Germany
6
Charles University in Prague, Faculty of Mathematics and Physics, Astronomical Institute, V Holešovičkách 2, 18000 Praha, Czech Republic
7
Max Planck Institute for Astronomy, Königstuhl 17, 69117 Heidelberg, Germany
8
Department of Astronomy, University of Maryland, College Park, MD 20742, USA
9
National Research Council Canada, Herzberg Programs in Astronomy and Astrophysics, Dominion Radio Astrophysical Observatory, PO Box 248 Penticton, BC V2A 6J9, Canada
10
Observatories of the Carnegie Institution for Science, 813 Santa Barbara Street, Pasadena, CA 91101, USA
11
Asociación Astronómica AstroHenares, 28823 Coslada, Madrid, Spain
Received:
16
June
2021
Accepted:
22
October
2021
Abstract
A fully sampled and hitherto highest resolution and sensitivity observation of neutral hydrogen (H I) in the Leo Triplet (NGC 3628, M 65/NGC 3623, and M 66/NGC 3627) reveals six H I structures beyond the three galaxies. We present detailed results of the morphologies and kinematics of these structures, which can be used for future simulations. In particular, we detect a two-arm structure in the plume of NGC 3628 for the first time, which can be explained by a tidal interaction model. The optical counterpart of the plume is mainly associated with the southern arm. The connecting part (base) of the plume (directed eastward) with NGC 3628 is located at the blueshifted (western) side of NGC 3628. Two bases appear to be associated with the two arms of the plume. A clump with a reversed velocity gradient (relative to the velocity gradient of M 66) and a newly detected tail, that is to say M 66SE, is found in the southeast of M 66. We suspect that M 66SE represents gas from NGC 3628, which was captured by M 66 in the recent interaction between the two galaxies. Meanwhile gas is falling toward M 66, resulting in features previously observed in the southeastern part of M 66, such as large line widths and double peaks. An upside-down “Y”-shaped H I gas component (M 65S) is detected in the south of M 65, which suggests that M 65 may also have been involved in the interaction. We strongly encourage modern hydrodynamical simulations of this interacting group of galaxies to reveal the origin of the gaseous debris surrounding all three galaxies.
Key words: galaxies: individual: Leo Triplet / galaxies: interactions / galaxies: ISM / galaxies: peculiar / radio lines: galaxies
Talentia Senior Fellow.
© G. Wu et al. 2022
 Open Access article, published by EDP Sciences, under the terms of the Creative Commons Attribution License (https://creativecommons.org/licenses/by/4.0), which permits unrestricted use, distribution, and reproduction in any medium, provided the original work is properly cited.
Open Access funding provided by Max Planck Society.
1. Introduction
Interactions between galaxies have significant impacts on their participants, leading to asymmetries, warps, and exchange of gas and momentum. These interactions can finally result in noncircular potentials, leading to an inflow of gas, enhancement of bars, and also triggering starburst activity in the galaxies. An excellent example is the Leo Triplet galaxy system (see the left panel of Fig. 1), also known as Arp 317 (Arp 1966), mainly including the SAB(rs)a galaxy M 65 (NGC 3623), the SAB(s)b galaxy M 66 (NGC 3627), and the SAb pec galaxy NGC 3628.
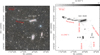 |
Fig. 1. Left panel: full-color optical image of the Leo Triplet obtained with a 10.6-cm Takahashi FSQ106EDX apocromatic refractor (see Sect. 2.2). Right panel: peak intensity image of the H I spectra in the Leo Triplet system. The galaxies of NGC 3628, M 65, and M 66 are labeled in black and the H I structures beside the three galaxies are labeled in red. |
The most famous feature in this system is probably the spectacular tail (the plume) from NGC 3628 extending toward the east. The plume was first detected by Zwicky (1956) and Kormendy & Bahcall (1974) via optical observations. Then Rots (1978) and Haynes et al. (1979) reported neutral hydrogen (H I) observations in the Leo Triplet and revealed a ≈150 kpc (rescaled to a distance of 11.3 ± 0.5 Mpc) long H I structure1 consistent with its optical counterpart. In these H I observations, an additional bridge-like structure is also detected extruding from NGC 3628 and likely pointing southward to M 66. Rots (1978) applied the methods of Toomre & Toomre (1972) and basically recovered the morphologies and kinematics of H I plume and bridge by assuming a recent (8 × 10⁸ years ago) tidal encounter between NGC 3628 and M 66. However, there remained some tension between the model and the observational data as argued by Haynes et al. (1979). Moreover, according to the scenarios simulated by Toomre & Toomre (1972), the bridge seems to be too prominent for two galaxies with similar total masses (e.g., Rots 1978).
In spite of that, major mergers (involving two galaxies with comparable mass) are the commonly cited mechanism to explain the observations. An alternative is that a nonmerger tidal interaction between passing galaxies with comparable masses pulls out tidal tails. Such strong encounters are only possible if dynamical friction on the extensive dark matter halos does not operate (Kroupa 2015; Renaud et al. 2016). Evidence for interactions either related to M 66 or NGC 3628 have also been found in optical, radio continuum, spectroscopic, and polarization observations (e.g., Rots 1978; Haynes et al. 1979; Young et al. 1983; Baan & Goss 1992; Zhang et al. 1993; Wilding et al. 1993; Reuter et al. 1996; Chromey et al. 1998; Soida et al. 2001; Chemin et al. 2003; Dumke et al. 2011; Weżgowiec et al. 2012). However, previous simulations and observations are mainly focused on the interaction between M 66 and NGC 3628. The role of the third member, M 65, in this triplet system has remained unclear. On the one hand, M 65 looks quiescent and no clear distortion is seen in it, which supports the view that M 65 is not involved in the interaction (e.g., Afanasiev & Sil’chenko 2005; Duan 2006). On the other hand, simulations of the interaction solely between NGC 3628 and M 66 still show some discrepancies with observations (e.g., Haynes et al. 1979; Jennings et al. 2015).
An alternative scenario for the formation of the giant tidal tail associated with NGC 3628 has also been discussed more recently, the minor merger (i.e., a merger between a large and a less massive satellite galaxy). Within the hierarchical galaxy formation framework, minor mergers are expected to be significantly more common than mergers with comparable masses at the current epoch (e.g., Cole et al. 2000). If the satellite galaxies become tidally disrupted, they should leave behind extended low surface brightness substructures known as tidal streams (e.g., Martínez-Delgado et al. 2010, 2015). Two typical examples in our local volume are the Sagittarius tidal stream surrounding our Milky Way (e.g., Majewski et al. 2003) and the Great Southern stream around the Andromeda galaxy (e.g., Ibata et al. 2001). Recently, Jennings et al. (2015) identified and characterized a compact massive star cluster, NGC 3628-UCD1, embedded in the base of the plume. It shows similar characteristics as the most massive Milky Way globular cluster, ω Centauri, which is believed to be a stripped dwarf galaxy remnant (e.g., Bekki & Tsujimoto 2019). NGC 3628-UCD1 (see Sect. 4.1 below) is also surrounded by a resolved stellar population showing a typical S-shaped structure, which strengthens the scenario of a young tidal stream. Therefore, Jennings et al. (2015) suggested the possibility of a minor merger between NGC 3628 and a dwarf elliptical galaxy (the progenitor of the star cluster NGC 3628-UCD1) adding additional complexity to the standard interaction scenario.
The appendages, that is tails and bridges, provide a fossil record of the interaction history and pose constraints on dynamical models. To recover the morphologies and kinematics of these appendages provides a principal benchmark for dynamical models (e.g., Rots 1978; Haynes et al. 1979). H I observations bring enormous convenience to identifying appendages. For example, the H I plume (Haynes et al. 1979) is more remarkable than the faint optical plume (Kormendy & Bahcall 1974) and so far no CO has been detected from the plume (Young et al. 1983). Meanwhile, to obtain a full view of the appendages, the observations should include the three galaxies but should also cover a more extended region. Previous H I observations covering the entire Leo Triplet system were all conducted with the Arecibo 305 m telescope with a resolution of about 4′ (Haynes et al. 1979; Stierwalt et al. 2009). Higher resolution and sensitivity observations are required to further constrain the dynamical model and to also clarify the origin of some interesting features observed in this system. For example, the H I emission observed along the plume surprisingly shows an almost constant velocity field but contains two velocity regimes (Haynes et al. 1979). A “peculiar velocity” clump is detected in the southeast of M 66 which is found to be not corotating with M 66 (Haynes et al. 1979; Zhang et al. 1993).
In this paper, we report high resolution and sensitivity fully sampled neutral hydrogen observations of the entire Leo Triplet system by combining VLA and Arecibo observations. We provide detailed morphologies and kinematics of the appendages and seek to understand the interaction history of this system.
2. Observations
2.1. VLA and Arecibo observations
The VLA observations (Project code: AB1074, PI: A. Bolatto) were conducted on 2003 March 29th and 30th in the D configuration. Eighteen fields were used to completely cover the Leo Triplet and the integration time on each field is ≳40 min. The details of the observations are summarized in Table 1. Calibration of the VLA observations was performed with the VLA pipeline in AIPS2 and the continuum was subtracted from the visibilities using the task “uvlin” with a linear fit. The visibilities are then imaged and cleaned in CASA (McMullin et al. 2007) using a “multiscale” clean in the “tclean” task. Within a clean mask defined by the “auto-multithresh” algorithm, the emission is cleaned down to 1.5 mJy beam−1 (≈3σ). The synthesized beam is 61 06 × 59
 40 at PA ≈ −65° and the pixel size is 15″. The channel spacing is ΔV = 20.7 km s−1 (see Table 1). The rms noise in a single channel is σrms ≲ 0.43 mJy beam−1.
Summary of the VLA observations.
The Arecibo observations (Project code: A1581, PI: Bolatto) were conducted over 11 days from 2002 April 7 through 2002 April 20. A  × 1
× 1 5 area of the sky was covered by the Arecibo observations using the on-the-fly mapping technique (see Fig. B.1) with a total observing time of about 27.25 h. These data were used to fill the zero spacing of the VLA HI observations. The L-band Narrow dual-polarization frontend (Tsys ≈ 30 K) was used in combination with the correlation backend configured for 9-level sampling over a 6.125 MHz bandwidth with 2048 channels. This yielded a 1320 km s−1 bandpass sampled in 0.64 km s−1-wide channels. At this frequency, the telescope has a full width at half maximum (FWHM) beam width of ≈3.3′. The orthogonal polarizations were combined by weighting by the reciprocal of the squares of their noise levels. The polarization-averaged on-the-fly (OTF) data were sampled onto a regular grid after applying a slant orthographic projection and a Gaussian convolution function with an FWHM of 3
 3. An effective integrated time per beam is about 70 s. The rms noise in a single channel is σrms ≲ 3.6 mJy beam−1. The interferometric and single dish cubes were combined with “immerge” (revision 1.7) in miriad (Sault et al. 1995) and the weighting factor between Arecibo and VLA is set to unity. The rms noise in a single channel of the combined data is σrms ≲ 0.5 mJy beam−1. Integrated over the full velocity range of a single channel, this yields σch = σrms × ΔV ≲ 0.01 Jy beam−1 km s−1.
Here we also roughly estimate the flux recovered by the combined data. The integrated line fluxes are all obtained by integrating from VHEL = 506.7 to 1125.1 km s−1 (see Sect. 3). Then the total flux of the combined data is found to be 220.5 Jy km s−1 by spatially integrating the pixels with signal-to-noise ratios (S/Ns) larger than 5. Within the same pixels, the total flux of the VLA data is 185.6 Jy km s−1. The total flux of the Arecibo data within the pixels with S/Ns larger than 5 is 233.1 Jy km s−1. Therefore, the combined data have recovered most of the flux filtered by the VLA. The total H I mass of the Leo Triplet system is 6.6 × 10⁹ M⊙ by using the expression MHI = 2.36 × 10⁵
 ∫Sνdν (van Gorkom et al. 1986), which is consistent with the results reported by Stierwalt et al. (2009) (≈9 × 10⁹ M⊙) and Haynes et al. (1979) (≈3 × 10⁹ M⊙) for the distance of 11.3 Mpc adopted here.
In this paper, if not otherwise noted, H I maps represent the combined data. The velocity-integrated emission (zeroth moment), intensity-weighted velocity (first moment), and intensity-weighted velocity dispersion (second moment) maps are all constructed using the routines in the GILDAS software package3. A 3σch threshold, where σch is the rms noise level in a channel, is used to derive the first and second moment maps in order not to emphasize noisy features.
2.2. Optical observations
An optical wide-field image of the Leo Triplet was obtained using high throughput clear filters with near-IR cut-off, known as luminance filters with a Takahashi FSQ106EDX 106 mm F/5 apochromatic refractor at native focal length (530 mm) operated in Cuenca and Guadalajara (Spain) during 2019. It used an Atik 16200 CCD camera and Astrodon LRGB filters with a pixel scale of 2 34. The reduction was carried out with the usual steps of bias and dark subtraction. The flat-fielding was done in Pixinsight, using a Geoptik 200-mm flat-field generator. Astrometry was obtained using SCAMP (Bertin 2006). A final stacked image (see Fig. 1, left panel) was obtained by combining the 25 × 600-s best images in luminance and the 18 × 300-s best images in RGB filters, with a total exposure time of 520 min (8.40 h).
3. Results
We first present the peak intensity (the intensity of the strongest channel) image of the H I data to show the overall distribution of all the various H I components and to highlight the narrow features in the right panel of Fig. 1. Here, we see that several structures, that is the plume, NGC 3628W, NGC 3628S, NGC 3628SW, IC 2767, M 66SE, and M 65S (named after their relative positions except the plume and IC 2767), in addition to NGC 3628, M 65, and M 66, can clearly be identified and also labeled. We should note that the peak intensity map in the right panel of Fig. 1 biases the H I emission against that of galaxies with broad and irregular profiles.
Therefore, the H I zeroth moment (integrated intensity) and first moment (velocity) maps are presented in Fig. 2 to show the overall distributions of the H I emission and velocity distributions in the system. In the left panel, contours and the color image show the zeroth moment map. The integration range is from VHEL = 506.7 to 1125.1 km s−1 to cover all the H I features. The contour levels are set to (5, 15, 25, 35, 45, …, 145)×σ Jy beam−1 km s−1. The uncertainty of the integrated image σ is set to  Jy beam−1 km s−1, where σch is the typical noise in a single channel (see Sect. 2), and Nch is the number of channels in the integrated velocity range (Nch = 28 for Fig. 2). We also use three blue dashed ellipses in the left panel to cover the main H I emission regions of the three galaxies. More importantly, the same ellipses are also added to Figs. 3–9 to indicate the relative locations of the features. In the right panel of Fig. 2, the color image shows the first moment map. The contours overlaid show the zeroth moment map in the same way as the left panel.
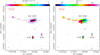 |
Fig. 2. H I velocity-integrated emission (zeroth moment, left panel) and intensity-weighted velocity (first moment, right panel) maps. The integration range is from VHEL = 506.7 to 1125.1 km s−1 to cover all the H I features. In both panels the contour levels are set to (5, 15, 25, 35, …, 145)×0.055 Jy beam−1 km s−1. The galaxies NGC 3628, M 65, and M 66 are labeled in both panels and a tiny filled ellipse in the lower left shows the beam. The red line in the upper left illustrates the 50 kpc scale at a distance of 11.3 Mpc. Three blue dashed ellipses in the left panel demonstrate the main H I emission regions of the three galaxies. |
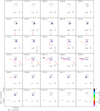 |
Fig. 3. Heliocentric velocity channel maps of the H I emission. The contours in all the panels start at 3σch and go up in steps of 9σch, where σch = 0.01 Jy beam−1 km s−1 (see Sect. 2). The galaxies NGC 3628, M 65, M 66 are labeled in each panel in black. M 66SE (640.7–702.5 km s−1), NGC 3628S (764.3–867.4 km s−1), NGC 3628SW (826.2–888.0 km s−1), M 65S (743.7–764.3 km s−1), the plume (805.6–929.2 km s−1), and IC 2767 (1032.3–1114.7 km s−1) are also labeled (in red) in their detected channels. The three blue dashed ellipses demonstrate the locations of the three galaxies belonging to the Leo Triplet. |
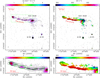 |
Fig. 4. H I velocity-integrated emission (zeroth moment) and intensity-weighted velocity (first moment) maps of the plume. Top two panels: in the left panel, contours and also the color image show the zeroth moment map. The integration range is from VHEL = 795.3 to 939.5 km s−1. The contour levels are set to (3, 6, 9, 12, 15, 18, 21, 30, 40, 50, 60, …, 180) × 0.027 Jy beam−1 km s−1. The green ellipses demonstrate the clumps detected in the plume. Right panel: color image shows the first moment map. The contours overlaid are the same as the ones in the left panel. The galaxies NGC 3628, M 65, M 66, and NGC 3628E (the plume) are also labeled in both panels and a filled ellipse in the lower left shows the synthesized beam. The red line in the top left illustrates the 50 kpc scale at a distance of 11.3 Mpc. The three blue dashed ellipses demonstrate the locations of the three galaxies. Bottom two panels: same as the top two panels but zooming into the region that is illustrated by the green dashed rectangle in the top left panel. The black solid and dashed lines in the lower left panel show the loci and the averaged width of the radial profiles in Fig. 11. |
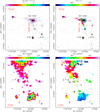 |
Fig. 5. Same as Fig. 4, but for NGC 3628S. The velocity range is from 754.0 to 878.7 km s−1. The contour levels are set to (3, 6, 9, 12, 15, 18, 21, 30, 40, 50, 60, …, 180) × 0.025 Jy beam−1 km s−1. |
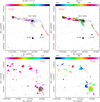 |
Fig. 6. Same as Fig. 4 but for NGC 3628SW. The velocity range is from 815.9 to 898.3 km s−1. The contour levels are set to (3, 6, 9, 12, 15, 18, 21, 30, 40, 50, 60, …, 150) × 0.021 Jy beam−1 km s−1. |
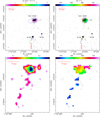 |
Fig. 7. Same as Fig. 4 but for M 66SE. The velocity range is from 630.3 to 712.8 km s−1. The contour levels are set to (3, 6, 9, 12, 15, 18, 21, 30, 40, 50, 60, …, 170) × 0.023 Jy beam−1 km s−1. |
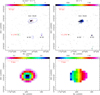 |
Fig. 8. Same as Fig. 4 but for IC 2767. The velocity range is from 1022.0 to 1125.1 km s−1. The contour levels are set to (3, 13, 23, 33, 43, 53, 63, …, 193) × 0.023 Jy beam−1 km s−1. |
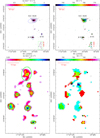 |
Fig. 9. Same as Fig. 4 but for M 65S. The velocity range is from 733.4 to 774.6 km s−1. The contour levels are set to (3, 6, 9, 12, 15, 18, 21, 30, 40, 50, …, 170) × 0.015 Jy beam−1 km s−1. |
We can see in Fig. 2, NGC 3628, M 65, and M 66 are all detected in the zeroth moment map (left panel), and all show clear velocity gradients in the first moment map (right panel). However, the weaker features revealed by the right panel of Fig. 1 only appear in a relatively narrow velocity range. Due to the large σ, proportional to  , only the plume can be seen in the vicinity of NGC 3628 in Fig. 2.
To further investigate the features along the velocity axis, we present the channel maps in Fig. 3, each one covering 20.7 km s−1. The contours in all the panels start at 3σch and go up in steps of 9σch, where σch is the typical noise of the integrated intensity in an individual channel (see Sect. 2). The additional structures with narrow line widths, M 66SE (640.7–702.5 km s−1), NGC 3628S (764.3–867.4 km s−1), NGC 3628SW (826.2–888.0 km s−1), M 65S (743.7–764.3 km s−1), the plume (805.6–929.2 km s−1), and IC 2767 (1032.3–1114.7 km s−1) are also labeled in Fig. 34. The remaining structures are consistent with previous Arecibo H I observations (e.g., Stierwalt et al. 2009) but the angular resolution of our observations is about four times better.
To emphasize these structures and their velocity distribution, we present, in Figs. 4–9, their zeroth moment and first moment maps within their specific velocity ranges mentioned above. In these figures, the top two panels present the full view of the distributions of H I emission and velocity, while the two lower panels show zoomed images of these structures. We note that these integrated ranges do not fully cover the H I emission in the three galaxies, which means only a part of HI emission in each of the galaxies is shown in Figs. 4–8.
The plume. Figure 4 presents the zeroth moment (left two panels) and the first moment (right two panels) maps of the plume. In all the panels, the integrated velocity range is from VHEL = 795.3 to 939.5 km s−1 to highlight the emission from the plume. The uncertainty of the velocity-integrated intensity  Jy beam−1 km s−1, where σch ≈ 0.01 Jy beam−1 km s−1 (see Sect. 2) and Nch = 7.
From Fig. 4 we can see that there are plenty of condensations along the plume and the strongest one is located at the eastern tip, which was proposed to be a tidal dwarf galaxy by Nikiel-Wroczyński et al. (2014). The H I spectra in the plume are extremely narrow and there is little velocity variation along the plume. Our Arecibo data have a better velocity resolution of about 1.9 km s−1 after smoothing three contiguous velocity channels (see Appendix B). As can be seen in the right two panels of Fig. B.1, the narrowest spectra have FWHM line widths of about 20 km s−1, evident in the middle of the plume. These characteristics have also been presented by previous H I observations (e.g., Haynes et al. 1979). However, our observations spatially resolve the four H I clumps revealed by Stierwalt et al. (2009) into about 11 condensations (see Table 2 and Fig. 4). The condensations are identified by the astrodendro package5 (Rosolowsky et al. 2008) with an intensity threshold (min_value) of 5σ and a size threshold (min_npix) of 10 pixels. The minimum intensity difference (min_delta) to be considered an independent entity (leaf or branch in the package) is set to 1σ as suggested by the package. The 11 condensations along the plume are reminiscent of the chains of tidal dwarfs that were seen in the Dentist’s Chair galaxy (Weilbacher et al. 2002), the Tadpole galaxy (Tran et al. 2003), and in simulations of tidal tails (Wetzstein et al. 2007; Noreña et al. 2019).
Condensations in the plume.
Here we want to emphasize features that have not been noticed before. From the zeroth moment map of Fig. 4 we can see that the H I emission at the eastern tip and middle of the plume shows two branches separated by centrally located weaker H I emission. Moreover, from the first moment map we can see that there are clearly two different velocities in the two branches, which are also evident in the Arecibo data in Fig. B.1. From a combined view of the zeroth and first moment maps, we find that the northern branch belongs to a not completely continuous elongated structure with velocities of about 850 km s−1, while the stronger southern branch shows velocities closer to 900 km s−1. The northern side of the plume exhibits more diffuse gas than the southern one. There is no smooth transition between the two velocity components. Instead, the velocity field looks more like an overlap of two spatially and kinematically distinct gas filaments, which are likely caused by two well-separated arms in the plume drawn out from NGC 3628. This is further discussed in a more comprehensive manner in Sect. 4.
NGC 3628S. Figure 5 presents the zeroth moment (left two panels) and the first moment (right two panels) maps of NGC 3628S. In all the panels the velocity ranges from VHEL = 754.0 to 878.7 km s−1. The uncertainty of the velocity-integrated intensity  = 0.025 Jy beam−1 km s−1, where σch ≈ 0.01 Jy beam−1 km s−1 (see Sect. 2) and Nch = 6.
From the zeroth moment map we can see that NGC 3628S extrudes from NGC 3628 with a uniform intensity of around 3σ toward the south. The strongest emission of about 12σ is found at the southern tip. Several pixels with intensities of about 3σ further to the east (≈5′) are beyond the scope of this work because of their limited size and intensities. The first moment map shows an overall velocity gradient in a roughly north-south direction along NGC 3628S, but with large dispersions. According to the categories in Toomre & Toomre (1972) and assuming that there was a tidal interaction between NGC 3628 and M 66, this part should be the “bridge”. However, this bridge seems to be too prominent with respect to simulations of encounters of galaxies with similar total masses (e.g., Rots 1978). According to the model provided by Toomre & Toomre (1972), the material in the bridge might eventually fall back to the original galaxy, that is NGC 3628 in this case. Again, assuming that this is a bridge caused by tidal interaction, the velocity gradient along NGC 3628S might be caused by the gas falling back.
NGC 3628SW. Figure 6 presents the zeroth moment (left two panels) and the first moment (right two panels) maps of NGC 3628SW. In all the panels the velocity ranges from VHEL = 815.9 to 898.3 km s−1. The uncertainty of the velocity-integrated intensity  = 0.021 Jy beam−1 km s−1, where σch ≈ 0.01 Jy beam−1 km s−1 (see Sect. 2) and Nch = 4.
From the zeroth moment map of Fig. 6, we can see that NGC 3628SW consists of several pieces of small H I clouds and a strongest condensation reaching a peak at about the 12σ level. These cloudlets seem to form an arc-like structure first oriented west- and then southward and seem to be connected to NGC 3628. The strong compact condensation at the end of the arc-like structure may show a northeast-southwest velocity gradient with blue velocities in the northeast.
M66 SE. Figure 7 presents the zeroth moment (left two panels) and the first moment (right two panels) maps of M 66SE. The velocity range is from VHEL = 630.3 to 712.8 km s−1 in all the panels. The uncertainty of the velocity-integrated intensity  = 0.023 Jy beam−1 km s−1, where σch ≈ 0.01 Jy beam−1 km s−1 (see Sect. 2) and Nch = 5.
From the zeroth moment map of Fig. 7 we can see that the main part of M 66SE consists of a strong round clump and a faint tail extending to the south. On its western side, there are also a few separate pixels with emission of around 3σ, which are beyond the scope of this paper because of their limited sizes and intensities. From the first moment map we can see that the dense clump presents a south-north velocity gradient with highest velocities in the north. Meanwhile this velocity gradient is reversed compared to the velocity gradient of M 66 (Fig. 2). The faint tail in the south of the clump shows velocities of about 640 km s−1. We further discuss this structure in Sect. 4.
IC 2767. Figure 8 presents the zeroth moment (left two panels) and the first moment (right two panels) maps of IC 2767. The velocity range is from VHEL = 1022.0 to 1125.1 km s−1 in all the panels. The uncertainty of the velocity-integrated intensity  = 0.023 Jy beam−1 km s−1, where σch ≈ 0.01 Jy beam−1 km s−1 (see Sect. 2) and Nch = 5.
This H I structure is a compact source with an ≈34 km s−1 arcmin−1 east-west velocity gradient with blue velocities in the east. According to its location and velocity gradient, it is probably associated with the galaxy IC 2767 as is also suggested by Stierwalt et al. (2009). The systemic velocity of IC 2767 is 1080 km s−1 (Haynes et al. 2011; Gavazzi et al. 2012) which is consistent with that of the H I observations. The distance of IC 2767 is much larger than that of the Leo Triplet. Gavazzi et al. (2012) and Haynes et al. (2011) suggested 19.6 and 24 Mpc, respectively, which means IC 2767 is not likely a member of the Leo Triplet.
M 65S. Figure 9 presents the zeroth moment (left two panels) and the first moment (right two panels) maps of M 65S. The velocity range is from VHEL = 733.4 to 774.6 km s−1 in all the panels. The uncertainty of the velocity-integrated intensity  = 0.015 Jy beam−1 km s−1, where σch ≈ 0.01 Jy beam−1 km s−1 (see Sect. 2) and Nch = 2.
Stierwalt et al. (2009) also detected a diffuse cloud in this region with Arecibo observations. Our observations resolve it into about 7 main clumps (see Table 3 and Fig. 9) with intensities of 3−9σ, forming an upside-down “Y” morphology. The condensations are identified by the astrodendro package with min_value = 5σ, min_npix = 5, and min_delta = 1σ. From the first moment map we can see that M 66S shows an irregular velocity field. It is helpful to first figure out which galaxy (M 65 or M 66) this structure is associated with. Firstly, M 65S is nearly equidistant with respect to the two galaxies, but slightly closer to M 65. Secondly, the velocities of M 65S range from 743.7 to 764.3 km s−1 and are well separated from those of M 66SE (640.7–702.5 km s−1). Thus M 65S is not likely a part of M 66SE. Meanwhile M 65S is also well separated from the orbit of the tidal interaction model with NGC 3628 and M 66 (e.g., Rots 1978). Thirdly, M 65 is located along the extension of the elongated M 65S structure. Based on these admittedly not very strong arguments, it seems plausible that M 65S is associated with M 65.
Condensations in M 65S.
Following this idea, M 65 might have been involved in the interaction of this triplet system, either having participated in the direct interaction with (one of) the other two galaxies or representing a captured part of the gas from the relic of the interaction between NGC 3628 and M 66.
4. Discussion
In Sect. 3, we have presented specific morphologies and kinematics of the appendages in the Leo Triplet. Compared with previous H I observations conducted with Arecibo (Haynes et al. 1979; Stierwalt et al. 2009), our higher resolution observations show unprecedented details of these appendages. Our observations resolve the previously known four H I clumps into 11 condensations along the plume. Furthermore, we also demonstrate for the first time that the plume shows not only a kinematical but also a spatial two-branch morphology. We also reveal a more detailed morphology of the southern bridge of NGC 3628 (NGC 3628S) and an overall velocity gradient along NGC 3628S. This is different from the finding of Haynes et al. (1979) who suggested irregular velocities on the basis of lower angular resolution data. The gas at the southwestern side of NGC 3628 (NGC 3628SW) is seen for the first time in an arc-like structure which seems to be connected with NGC 3628. We clearly show a separated clump with a reversed velocity gradient relative to the velocity gradient of M 66 and a newly detected tail connected with the clump and extending southward (M 66SE). We resolve the diffuse gas detected by Stierwalt et al. (2009) in the south of M 65 into 7 clumps with intensities of 3−9σ forming an upside-down Y morphology (M 65S), which is likely associated with M 65.
Below, we shall discuss several interesting features based on the results in Sect. 3.
4.1. Two arms in the plume
In the pioneering work by Toomre & Toomre (1972), it has been proven that the far side of the victim galaxy (a point mass surrounded by a disk of test particles–NGC 3628 in this case) relative to the pericenter of the interaction would form a long and slender “counterarm” (see e.g., their Fig. 3 for the motions of the outer disk). The formation of the slender structure is caused by lagging test particles (the backward arm relative to the victim galaxy), which are accelerated more by the companion galaxy (point mass without disk–M 66 in this case), overtaking the forward arm forming a relatively narrow counterarm. However, as has been argued by Toomre & Toomre (1972), the observed structure of this narrow feature relies on the viewing angle. The counterarm will show a two-arm structure at some angles.
As we have mentioned in Sect. 3, a two-branch morphology is observed at the eastern tip and middle of the plume. The northern, more diffuse gas shows a coherent velocity field, and the velocity field of the plume looks more like two overlapping velocity regimes since there is no smooth transition between the two velocities. Furthermore, we can also find evidence hinting at the existence of two arms in the plume in the 867.4 and 888.0 km s−1 maps of Fig. 3. In the 867.4 km s−1 map, there is a clear jump in the middle of the plume which shows an elongated morphology. Meanwhile, in the 888.0 km s−1 map, we can also see a two branch structure in the middle of the plume.
Compared with the zeroth moment image, the right panel of Fig. 1 (the peak intensity image) highlights the H I emission in the appendages, especially the H I emission in the plume due to their simple (usually Gaussian) and spectrally narrow profiles. From the right panel of Fig. 1, we can clearly see a two-arm feature in the plume which is in good agreement with simulations (e.g., Toomre & Toomre 1972; Renaud et al. 2016). We note that probably because the western part of the upper branch (especially the part near NGC 3628) is too weak to show a continuous morphology in our observations there exist some separated regions of enhanced emission along its extension direction. Just from this projected image, it is hard to deduce the 3D distribution of these two arms. Combined with the consistent velocity distributions in Fig. 4, it is possible that the lower red arm is the catching-up arm, and the upper green arm is the forward arm, which needs to be verified by additional simulations.
Although the Arecibo H I observations did not show the two-arm structure due to their lower angular resolution (e.g., Haynes et al. 1979; Stierwalt et al. 2009), we note that these data showed already double-peaked spectra in the plume (see the panel b in Fig. 7 of Haynes et al. 1979), which is consistent with our more recently taken Arecibo map. Two clear velocity regimes are shown in the middle panels of Fig. B.1. We conclude that we have identified a spatially well-separated two-arm structure in the plume for the first time by our high-resolution H I observations. The structure can be explained by the tidal interaction model. The detection of the catching-up sub arms in the plume could also be an important constraint on the interaction models.
Finally, we compare the H I plume with its optical counterpart. The top panel of Fig. 10 presents the full-color optical image of the plume overlaid with the H I 3-σ contours which are the same as those in the lower panels in Fig. 4. We can see from this panel that the optical plume is mainly associated with the southern arm of the H I plume, that is the H I gas with velocities of about 900 km s−1 (see Fig. 4), which is also valid for the eastern tip of the plume. To further quantitatively explore the distribution of matter, we seek to derive the radial profiles of the H I and optical fluxes along the plume. We note that the optical observations derived from the amateur telescope show great details of the plume due to the long time exposure but are not calibrated. Thus here we only compare their relative flux distributions. The H I zeroth moment map (the lower left panel of Fig. 4) and the luminance-filter optical image (see Sect. 2.2) are used to extract the H I and optical fluxes along the plume. To enhance the emission of the plume in the optical image, we exclude the pixels with uncalibrated flux intensities larger than 0.003. The image of the remaining pixels is shown as the color image in the lower panel of Fig. 10. The H I and optical fluxes are derived along the loci shown by the black solid lines in the lower left panel of Fig. 4 and the lower panel of Fig. 10 by averaging the pixels within a width of 4′ (dashed lines in these panels). The final flux profiles are then normalized to the 0−1 range and shown in Fig. 11.
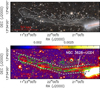 |
Fig. 10. Full-color optical image of the plume (top panel). The luminance-filter optical image of the plume (see Sect. 2.2) excluding the pixels with uncalibrated flux larger than 0.003 (lower panel). The 3-σ (3 × 0.027 Jy beam−1 km s−1) H I contours in the two panels are the same as those in the lower panels in Fig. 4. The green ellipses demonstrate the condensations identified in the plume. The black solid and dashed lines in the lower panel show the loci and the averaged width for the radial profiles in Fig. 11. |
As we can first see in the lower panel of Fig.10, the peaks of the H I and optical fluxes are generally consistent, except for two of the H I condensations (the second and sixth ones in Table 2) being likely associated with the northern arm and the optical peak near NGC 3628-UCD1. Then we can see in Fig. 11 that the H I and optical flux profiles are also roughly consistent with each other, especially the peaks at 5′ and 18′. The consistency of the optical and H I peaks has also been reported by Chromey et al. (1998). However, we can also see in Fig. 11 that there is a peak in the optical flux profile at about 37′ corresponding to the star cluster NGC 3628-UCD1. Here the H I profile shows a minimum. Furthermore, the H I profile indicates a peak at the eastern tip and then generally shows a flat distribution along the plume. The optical profile presents an overall increasing trend along the plume from the eastern tip to NGC 3628. A more comprehensive study of the plume will be conducted in a future contribution.
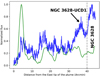 |
Fig. 11. Radial profiles of the H I (green line) and optical (blue line) fluxes along the plume. The loci are illustrated in the lower left panel of Fig. 4 and the lower panel of Fig. 10. The profiles with x-axis values larger than 40′ (gray dashed line) are likely affected by NGC 3628. |
4.2. Two bases of the plume
We now discuss the connecting part (base) of the plume with NGC 3628. From the right panel of Fig. 1 we can see that the lower arm of the plume seems to be connected with the western (blueshifted) side of NGC 3628. Due to the weak emission of the western part of the upper arm, we cannot clearly see the base of the upper arm. However, according to several separated cloudlets along its extension, it seems that the upper arm originates from a position to the west of that of the lower arm.
Wilding et al. (1993) conducted a study of VLA H I observations with a resolution of 15″ covering NGC 3628 and part (out to about 8′ from NGC 3628) of the plume. They found a “limb” structure with velocities from 650 to 750 km s−1 (most clearly shown at velocities around 691 km s−1), which is argued to be associated with the plume. Furthermore, they also found another warped H I gas component with velocities about 750 km s−1, which is not rotating with the disk. Wilding et al. (1993) suggested that this H I gas would eventually join the limb, being also a part of the plume.
The base of the plume is more clearly shown in the channel maps in Fig. 3. Firstly, from the 743.7 and 764.3 km s−1 maps in Fig. 3 we can clearly find a protruding structure extending northeastward. In the following maps with larger velocities, this protruding structure is smoothly connected with the lower arm of the plume. This protrusion may be associated with the warped H I gas found by Wilding et al. (1993). However, Wilding et al. (1993) did not detect the H I plume, which is shown in our 784.9 to 929.2 km s−1 maps in Fig. 3. This is probably the case because of their lower sensitivity (their rms noise in a 20.6 km s−1 wide channel is 0.04 Jy beam−1 km s−1, about four times larger than our σch ≈ 0.01 Jy beam−1 km s−1) and our combined VLA and Arecibo observations are more sensitive to the diffuse H I gas. Meanwhile, from the 702.5 km s−1 map, we can also see a protrusion of length ≈2′ extending northward, which is probably associated with the limb structure found by Wilding et al. (1993). In the following 723.1 km s−1 map it is still seen and there is a new smaller protrusion to its east.
As mentioned in Sect. 4.1, there are two arms in the plume. Meanwhile, the right panel of Fig. 1 shows that the upper arm seems to originate further to the west, which means its base should be more blueshifted. Thus it is plausible that the larger protrusion appearing both in the 702.5 and 723.1 km s−1 maps is the base of the fainter upper arm of the plume. In the simulation of the interaction between NGC 3628 and M 66 by Rots (1978), the motion of M 66 was prograde with respect to the revolution of NGC 3628. The resulting plume was corotating with NGC 3628 and located at the backside relative to NGC 3628 along the line of sight. The plume relative to the bases should show more redshifted velocities (see Fig. 4 in Rots 1978). This is consistent with the observed plume with velocities of 795.3–939.5 km s−1, which is more redshifted than the bases.
In summary, the plume originates from the blueshifted side of NGC 3628. There seem to exist two bases, associated with the two arms in the plume. The velocities of the bases of the upper and lower arms are about 700 and 750 km s−1, respectively.
4.3. The peculiar velocity clump and its tail
Haynes et al. (1979) detected an H I bump in the southeast of M 66 and found it to not corotate with M 66. Combining the H I data from Haynes et al. (1979) and CO (1−0) data, Zhang et al. (1993) further confirmed the existence of a peculiar velocity clump in the southeast of M 66. Through the analysis of the velocities of the spectra, they concluded that this seems to be a non-corotating clump that was pulled out of the inner spiral arms due to the close encounter of NGC 3628 and M 66. Zhang et al. (1993) also argued that the peculiar velocity clump is located at a high latitude, outside the plane of the disk of M 66.
The peculiar velocity clump identified by Haynes et al. (1979) and Zhang et al. (1993) is associated with the dominant clump observed by us in M 66SE. As we have mentioned in Sect. 3, the clump has a nearly reversed velocity gradient compared to that of M 66 which is consistent with the peculiar velocity found by Zhang et al. (1993). In addition, we also detected a tail connected with the clump and extending to the south for the first time. As can be seen from the first moment map of Fig. 7, the velocities of the tail and the clump can be roughly defined by a consistent velocity gradient.
In previous observations, the southeastern part of M 66 has shown some different features compared to the observations in the northwestern part. For example, significant changes in 12CO (2−1) to 13CO (2−1) line ratios over small scales are found in the southeastern region, the CO line widths seem to be larger than those of the northwestern part, and the lines are characterized by a double peak (e.g., Reuter et al. 1996; Dumke et al. 2011). Moreover, assuming that there has been an interaction between NGC 3628 and M 66 as suggested by Rots (1978), M 66SE is situated just on the orbit proposed by Rots (1978) at the forward direction of M 66. In the tidal interaction models of Toomre & Toomre (1972), there should be some material captured by the companion (M 66) from the victim galaxy (NGC 3628) at the location where M 66SE is situated. This scenario is clearly demonstrated in the simulations of Pawlowski et al. (2011) who showed that accreted tidal debris can form counter-orbiting satellite galaxies.
By combining the velocity pattern of M 66SE and the tidal model suggested by Rots (1978) and with M 66SE supposedly representing gas captured from NGC 3628 during the interaction, this gas may be falling back onto M 66 giving rise to the overall velocity gradient of the clump and tail and resulting in the features previously observed in the southeastern part of M 66, such as large line widths and double peaks.
4.4. The origin of the appendages
The last item to be discussed is the origin of the appendage structures and a brief comparison of our observations with the dynamical models in the literature. From an overall perspective, tidal interactions between NGC 3628 and the other member galaxies of the Leo Triplet are probably necessary to explain the rich appendage structures found in this system. However, the previous interaction models between NGC 3628 and M 66 (M 65 is typically excluded in these models) seem to be insufficient to fully explain our observations, for instance the prominent bridge (NGC 3628S) and M 65S.
Regarding the plume, its morphologies and kinematics have been basically reproduced by the tidal dynamical simulations between NGC 3628 and M 66 (Rots 1978). The newly detected two-arm structure in the plume and M 66SE can also be explained by the tidal models, but further simulations would be required in order to demonstrate this in more detail. As we have mentioned in the introduction, the alternative scenario of a minor merger is also proposed to explain the plume (Jennings et al. 2015). Specific simulations are required to compare these scenarios and to clarify whether the plume is a result of a minor merger between NGC 3628 and a dwarf galaxy or the by-product of the interaction between NGC 3628 and the other member galaxies (M 65 and/or M 66).
5. Summary
We have conducted detailed morphological and kinematic studies of the appendages of the Leo Triplet (e.g., NGC 3628, M 65/NGC 3623, and M 66/NGC 3627) by using high resolution and sensitivity fully sampled observations of the neutral hydrogen in this system. The main conclusions are:
-
We find six appendage structures besides the three galaxies, that is M 66SE (VHEL = 640.7–702.5 km s−1), NGC 3628S (764.3–867.4 km s−1), NGC 3628SW (826.2–888.0 km s−1), M 65S (743.7–764.3 km s−1), the plume (805.6–929.2 km s−1), and IC 2767 (1032.3–1114.7 km s−1). The morphologies and kinematics of these appendages can be used to constrain future kinematic models.
-
We detect a two-arm structure in the plume for the first time that can be explained, at least approximately, by the tidal interaction model. The optical counterpart of the plume is mainly associated with the southern arm in the H I plume, that is H I gas with velocities around 900 km s−1. The peaks of the normalized optical and H I flux profiles are approximately consistent. However, there is a significant discrepancy at the location of the star cluster NGC 3628-UCD1. Furthermore, the H I profile shows a roughly flat distribution along the plume from the eastern tip to NGC 3628. Instead, the optical profile presents an overall increasing trend.
-
There seem to be two bases associated with the two arms in the plume. The base of the lower arm connected with the western (blueshifted) side of NGC 3628 shows a velocity of about 750 km s−1. The base of the upper arm originates from a position to the west of that of the lower arm, showing a velocity about 700 km s−1. The two bases are likely associated with the limb structure and the warped H I gas component found by Wilding et al. (1993).
-
We find an H I clump with a reversed velocity gradient relative to the velocity gradient of M 66 and a tail extending to the south in the southeast of M 66 (M 66SE). By combining the velocity pattern of the clump and tail and the interaction model suggested by Rots (1978), we conclude that M 66SE may represent gas captured from NGC 3628. Meanwhile it is falling into M 66, resulting in the features previously observed in the southeastern part of M 66, such as large line widths and spectral double peaks.
-
An upside-down “Y” shaped H I gas component (M 65S) is detected in the south of M 65 and is probably associated with M 65. This suggests that M 65 might have been involved in the interaction of this triplet system, either having participated in the direct interaction with (one of) the other two galaxies or representing a captured part of the gas from the relic of the interaction between NGC 3628 and M 66.
Our high resolution observations show unprecedented details of these appendages in the Leo Triplet. From an overall perspective, tidal interactions between NGC 3628 and the other member galaxies of the Leo Triplet are probably necessary to explain the rich appendage structures. However, the previous interaction models between NGC 3628 and M 66 seem to be insufficient to fully explain our observations, for instance the prominent bridge (NGC 3628S) and M 65S. We strongly encourage modern hydrodynamical simulations of this interacting group of galaxies to reveal the origin of these structures detected in the Leo Triplet.
Anand et al. (2021) recently compiled a catalog of the best available distances of 118 galaxies. Here we adopt the average of the red giant branch distance of M 65 (11.3 ± 1.1 Mpc) and the group distances (from the galaxy group and numerical modeling of their orbits) of M 66 (11.32 ± 0.48 Mpc) and NGC 3628 (11.3 ± 1.1 Mpc) in Anand et al. (2021) as the distance to the Leo Triplet. See Jacobs et al. (2009) and Anand et al. (2021) for more details.
There is another H I structure appearing in the west of NGC 3628 which is very likely caused by a sidelobe (see Appendix A).
Acknowledgments
We thank an anonymous referee for useful suggestions improving the paper. GW thanks Dustin Lang and Dalei Li for helpful discussions and providing the DESI data. This work was funded by the CAS “Light of West China” Program under grant No. 2018-XBQNXZ-B-024 and the National Natural Science foundation of China under grant Nos. 11433008, 12173075, 12103082, and 11973076. G.W. acknowledges the support from Youth Innovation Promotion Association CAS. DMD acknowledges financial support from the Talentia Senior Program (through the incentive ASE-136) from Secretaría General de Universidades, Investigación y Tecnología, de la Junta de Andalucía. DMD acknowledges funding from the State Agency for Research of the Spanish MCIU through the “Center of Excellence Severo Ochoa” award to the Instituto de Astrofísica de Andalucía (SEV-2017-0709). DMD acknowledges funding from the State Agency for Research of the Spanish MCI (Project PDI2020-114581GB-C21/AEI/10.13039/501100011033). This research made use of astrodendro, a Python package to compute dendrograms of Astronomical data (http://www.dendrograms.org/). The National Radio Astronomy Observatory is a facility of the National Science Foundation operated under cooperative agreement by Associated Universities, Inc. The Arecibo Observatory is a facility of the National Science Foundation operated under cooperative agreement by the University of Central Florida and in alliance with Universidad Ana G. Mendez, and Yang Enterprises, Inc.
References
- Anand, G. S., Lee, J. C., Van Dyk, S. D., et al. 2021, MNRAS, 501, 3621 [Google Scholar]
- Cole, S., Lacey, C. G., Baugh, C. M., et al. 2000, MNRAS, 319, 168 [Google Scholar]
- Martínez-Delgado, D., Gabany, R. J., Crawford, K., et al. 2010, AJ, 140, 962 [Google Scholar]
- Martínez-Delgado, D., D’Onghia, E., Chonis, T. S., et al. 2015, AJ, 150, 116 [CrossRef] [Google Scholar]
- Afanasiev, V. L., & Sil’chenko, O. K. 2005, A&A, 429, 825 [NASA ADS] [CrossRef] [EDP Sciences] [Google Scholar]
- Arp, H. 1966, ApJS, 14, 1 [NASA ADS] [CrossRef] [Google Scholar]
- Baan, W. A., & Goss, W. M. 1992, ApJ, 385, 188 [NASA ADS] [CrossRef] [Google Scholar]
- Bekki, K., & Tsujimoto, T. 2019, ApJ, 886, 121 [NASA ADS] [CrossRef] [Google Scholar]
- Bertin, E. 2006, ASP Conf. Ser., 351, 112 [NASA ADS] [Google Scholar]
- Chemin, L., Cayatte, V., Balkowski, C., et al. 2003, A&A, 405, 89 [NASA ADS] [CrossRef] [EDP Sciences] [Google Scholar]
- Chromey, F. R., Elmegreen, D. M., Mandell, A., et al. 1998, AJ, 115, 2331 [NASA ADS] [CrossRef] [Google Scholar]
- Duan, Z. 2006, AJ, 132, 1581 [NASA ADS] [CrossRef] [Google Scholar]
- Dumke, M., Krause, M., Beck, R., et al. 2011, ASP Conf. Ser., 446, 111 [Google Scholar]
- Gavazzi, G., Fumagalli, M., Galardo, V., et al. 2012, A&A, 545, A16 [NASA ADS] [CrossRef] [EDP Sciences] [Google Scholar]
- Haynes, M. P., Giovanelli, R., & Roberts, M. S. 1979, ApJ, 229, 83 [NASA ADS] [CrossRef] [Google Scholar]
- Haynes, M. P., Giovanelli, R., Martin, A. M., et al. 2011, AJ, 142, 170 [Google Scholar]
- Ibata, R., Irwin, M., Lewis, G., et al. 2001, Nature, 412, 49 [NASA ADS] [CrossRef] [Google Scholar]
- Jacobs, B. A., Rizzi, L., Tully, R. B., et al. 2009, AJ, 138, 332 [NASA ADS] [CrossRef] [Google Scholar]
- Jennings, Z. G., Romanowsky, A. J., Brodie, J. P., et al. 2015, ApJ, 812, L10 [NASA ADS] [CrossRef] [Google Scholar]
- Kormendy, J., & Bahcall, J. N. 1974, AJ, 79, 671 [NASA ADS] [CrossRef] [Google Scholar]
- Kroupa, P. 2015, Can. J. Phys., 93, 169 [NASA ADS] [CrossRef] [Google Scholar]
- Toomre, A., & Toomre, J. 1972, ApJ, 178, 623 [Google Scholar]
- Majewski, S. R., Skrutskie, M. F., Weinberg, M. D., et al. 2003, ApJ, 599, 1082 [Google Scholar]
- McMullin, J. P., Waters, B., Schiebel, D., et al. 2007, ASP Conf. Ser., 376, 127 [NASA ADS] [Google Scholar]
- Noreña, D. A., Muñoz-Cuartas, J. C., Quiroga, L. F., et al. 2019, Rev. Mex. Astron. Astrofis., 55, 273 [Google Scholar]
- Nikiel-Wroczyński, B., Soida, M., Bomans, D. J., et al. 2014, ApJ, 786, 144 [CrossRef] [Google Scholar]
- Pawlowski, M. S., Kroupa, P., & de Boer, K. S. 2011, A&A, 532, A118 [NASA ADS] [CrossRef] [EDP Sciences] [Google Scholar]
- Reid, M. J., & Honma, M. 2014, ARA&A, 52, 339 [NASA ADS] [CrossRef] [Google Scholar]
- Renaud, F., Famaey, B., & Kroupa, P. 2016, MNRAS, 463, 3637 [NASA ADS] [CrossRef] [Google Scholar]
- Reuter, H.-P., Sievers, A. W., Pohl, M., et al. 1996, A&A, 306, 721 [NASA ADS] [Google Scholar]
- Rosolowsky, E. W., Pineda, J. E., Kauffmann, J., et al. 2008, ApJ, 679, 1338 [CrossRef] [Google Scholar]
- Rots, A. H. 1978, AJ, 83, 219 [NASA ADS] [CrossRef] [Google Scholar]
- Sault, R. J., Teuben, P. J., & Wright, M. C. H. 1995, ASP Conf. Ser., 77, 433 [NASA ADS] [Google Scholar]
- Soida, M., Urbanik, M., Beck, R., et al. 2001, A&A, 378, 40 [NASA ADS] [CrossRef] [EDP Sciences] [Google Scholar]
- Stierwalt, S., Haynes, M. P., Giovanelli, R., et al. 2009, AJ, 138, 338 [Google Scholar]
- Tran, H. D., Sirianni, M., Ford, H. C., et al. 2003, ApJ, 585, 750 [NASA ADS] [CrossRef] [Google Scholar]
- van Gorkom, J. H., Knapp, G. R., Raimond, E., et al. 1986, AJ, 91, 791 [NASA ADS] [CrossRef] [Google Scholar]
- Weilbacher, P. M., Fritze-v Alvensleben, U., Duc, P. A., et al. 2002, ApJ, 579, L79 [NASA ADS] [CrossRef] [Google Scholar]
- Wetzstein, M., Naab, T., & Burkert, A. 2007, MNRAS, 375, 805 [NASA ADS] [CrossRef] [Google Scholar]
- Weżgowiec, M., Soida, M., & Bomans, D. J. 2012, A&A, 544, A113 [NASA ADS] [CrossRef] [EDP Sciences] [Google Scholar]
- Wilding, T., Alexander, P., & Green, D. A. 1993, MNRAS, 263, 1075 [NASA ADS] [CrossRef] [Google Scholar]
- Young, J. S., Tacconi, L. J., & Scoville, N. Z. 1983, ApJ, 269, 136 [NASA ADS] [CrossRef] [Google Scholar]
- Zhang, X., Wright, M., & Alexander, P. 1993, ApJ, 418, 100 [NASA ADS] [CrossRef] [Google Scholar]
- Zwicky, F. 1956, Ergebnisse der exakten Naturwissenschaften, 29, 344 [Google Scholar]
Appendix A: NGC 3628W
NGC 3628W: Fig. A.1 presents the first moment (left panel) and the second moment (right panel) maps of NGC 3628W. The velocity range is from VHEL = 609.8 to 1063.2 km s−1 in both panels. The uncertainty of the velocity-integrated intensity  = 0.048 Jy beam−1 km s−1, where σch ≈ 0.01 Jy beam−1 km s−1 (see Sect. 2) and Nch = 22.
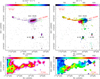 |
Fig. A.1. Same as Fig. 4 but for NGC 3628W. The velocity range is from 609.8 to 1063.2 km s−1 in both panels. The contour levels are set to (3, 6, 9, 12, 15, 18, 21, 30, 40, 50, …, 160) × 0.048 Jy beam−1 km s−1. |
As we can see in Fig. A.1, the morphology and velocity patterns of this structure are very similar to the strong central part of NGC 3628, that is they show a similar elongated morphology and velocity gradient. This feature is only present in the VLA data but is absent in the Arecibo data. Thus it is likely caused by the VLA sidelobes. It was also not seen in any other study in spite of its strength. Thus, we conclude that NGC 3628W is very likely a spurious feature. As a consequence, it is not part of our analysis.
Appendix B: The Arecibo Observations
We first masked the strong spikes in the spectra caused by radio frequency interference (RFI) and smoothed three contiguous velocity channels to enhance the S/N of the individual channels in the Arecibo data. The velocity resolution and the noise level of the smoothed data turn into 1.9 km s−1 and 2.0 mJy beam−1, respectively. Our noise level is slightly better than that in Stierwalt et al. (2009) (≈4 mJy beam−1 scaled to 1.9 km s−1). Figure B.1 shows the zeroth moment (left panels), first moment (middle panels), and second moment (right panels) of the Leo Triplet (top three panels) and the plume (lower three panels). The velocity ranges of the top and lower panels are from VHEL = 506.7 to 1125.1 km s−1 and 795.3 to 939.5 km s−1, respectively, which are the same as those for Fig. 2 and 4. The uncertainties of the upper and lower zeroth moment maps are 0.07 Jy beam−1 km s−1 and 0.03 Jy beam−1 km s−1. A threshold of 3σch, where σch is the noise level in a channel, is used to derive the first and second moment maps to avoid emphasizing contributions from spectral noise and the RFI.
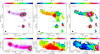 |
Fig. B.1. HI data exclusively from the Arecibo telescope with 3 |

We can see in the top left panel of Fig. B.1 that our Arecibo map is consistent with that presented by Stierwalt et al. (2009). We note that an about 10′-long spur, reported by Stierwalt et al. (2009) in the north of NGC 3628 extending further north, is not evident in our map. We checked our data and found a very narrow and faint feature with velocities of about 950 km s−1, which is similar to that reported by Stierwalt et al. (2009). But this feature is not discussed in our paper due to its poor S/N. Meanwhile, M 65S has also been detected by Stierwalt et al. (2009), but this feature extends further north in their map. These discrepancies might be partially caused by larger noise levels at the edges of our Arecibo images. From the middle panels, we can see that the Arecibo data show quite a similar velocity pattern as that seen in Figs. 2 and 4. In the plume, there are also two velocity regimes with similar spatial distributions as in Fig. 4. Since the Arecibo data have a better velocity resolution than the combined data, we further provide the second moment maps in Fig. B.1. From the two maps, we can see that the narrowest spectra are located in the middle of the plume, showing linewidths of about 20 km s−1, which is consistent with the observations in Haynes et al. (1979) and the velocity resolution of our combined Arecibo and VLA data.
All Tables
All Figures
|
Fig. 1. Left panel: full-color optical image of the Leo Triplet obtained with a 10.6-cm Takahashi FSQ106EDX apocromatic refractor (see Sect. 2.2). Right panel: peak intensity image of the H I spectra in the Leo Triplet system. The galaxies of NGC 3628, M 65, and M 66 are labeled in black and the H I structures beside the three galaxies are labeled in red. |
| In the text | |
|
Fig. 2. H I velocity-integrated emission (zeroth moment, left panel) and intensity-weighted velocity (first moment, right panel) maps. The integration range is from VHEL = 506.7 to 1125.1 km s−1 to cover all the H I features. In both panels the contour levels are set to (5, 15, 25, 35, …, 145)×0.055 Jy beam−1 km s−1. The galaxies NGC 3628, M 65, and M 66 are labeled in both panels and a tiny filled ellipse in the lower left shows the beam. The red line in the upper left illustrates the 50 kpc scale at a distance of 11.3 Mpc. Three blue dashed ellipses in the left panel demonstrate the main H I emission regions of the three galaxies. |
| In the text | |
|
Fig. 3. Heliocentric velocity channel maps of the H I emission. The contours in all the panels start at 3σch and go up in steps of 9σch, where σch = 0.01 Jy beam−1 km s−1 (see Sect. 2). The galaxies NGC 3628, M 65, M 66 are labeled in each panel in black. M 66SE (640.7–702.5 km s−1), NGC 3628S (764.3–867.4 km s−1), NGC 3628SW (826.2–888.0 km s−1), M 65S (743.7–764.3 km s−1), the plume (805.6–929.2 km s−1), and IC 2767 (1032.3–1114.7 km s−1) are also labeled (in red) in their detected channels. The three blue dashed ellipses demonstrate the locations of the three galaxies belonging to the Leo Triplet. |
| In the text | |
|
Fig. 4. H I velocity-integrated emission (zeroth moment) and intensity-weighted velocity (first moment) maps of the plume. Top two panels: in the left panel, contours and also the color image show the zeroth moment map. The integration range is from VHEL = 795.3 to 939.5 km s−1. The contour levels are set to (3, 6, 9, 12, 15, 18, 21, 30, 40, 50, 60, …, 180) × 0.027 Jy beam−1 km s−1. The green ellipses demonstrate the clumps detected in the plume. Right panel: color image shows the first moment map. The contours overlaid are the same as the ones in the left panel. The galaxies NGC 3628, M 65, M 66, and NGC 3628E (the plume) are also labeled in both panels and a filled ellipse in the lower left shows the synthesized beam. The red line in the top left illustrates the 50 kpc scale at a distance of 11.3 Mpc. The three blue dashed ellipses demonstrate the locations of the three galaxies. Bottom two panels: same as the top two panels but zooming into the region that is illustrated by the green dashed rectangle in the top left panel. The black solid and dashed lines in the lower left panel show the loci and the averaged width of the radial profiles in Fig. 11. |
| In the text | |
|
Fig. 5. Same as Fig. 4, but for NGC 3628S. The velocity range is from 754.0 to 878.7 km s−1. The contour levels are set to (3, 6, 9, 12, 15, 18, 21, 30, 40, 50, 60, …, 180) × 0.025 Jy beam−1 km s−1. |
| In the text | |
|
Fig. 6. Same as Fig. 4 but for NGC 3628SW. The velocity range is from 815.9 to 898.3 km s−1. The contour levels are set to (3, 6, 9, 12, 15, 18, 21, 30, 40, 50, 60, …, 150) × 0.021 Jy beam−1 km s−1. |
| In the text | |
|
Fig. 7. Same as Fig. 4 but for M 66SE. The velocity range is from 630.3 to 712.8 km s−1. The contour levels are set to (3, 6, 9, 12, 15, 18, 21, 30, 40, 50, 60, …, 170) × 0.023 Jy beam−1 km s−1. |
| In the text | |
|
Fig. 8. Same as Fig. 4 but for IC 2767. The velocity range is from 1022.0 to 1125.1 km s−1. The contour levels are set to (3, 13, 23, 33, 43, 53, 63, …, 193) × 0.023 Jy beam−1 km s−1. |
| In the text | |
|
Fig. 9. Same as Fig. 4 but for M 65S. The velocity range is from 733.4 to 774.6 km s−1. The contour levels are set to (3, 6, 9, 12, 15, 18, 21, 30, 40, 50, …, 170) × 0.015 Jy beam−1 km s−1. |
| In the text | |
|
Fig. 10. Full-color optical image of the plume (top panel). The luminance-filter optical image of the plume (see Sect. 2.2) excluding the pixels with uncalibrated flux larger than 0.003 (lower panel). The 3-σ (3 × 0.027 Jy beam−1 km s−1) H I contours in the two panels are the same as those in the lower panels in Fig. 4. The green ellipses demonstrate the condensations identified in the plume. The black solid and dashed lines in the lower panel show the loci and the averaged width for the radial profiles in Fig. 11. |
| In the text | |
|
Fig. 11. Radial profiles of the H I (green line) and optical (blue line) fluxes along the plume. The loci are illustrated in the lower left panel of Fig. 4 and the lower panel of Fig. 10. The profiles with x-axis values larger than 40′ (gray dashed line) are likely affected by NGC 3628. |
| In the text | |
|
Fig. A.1. Same as Fig. 4 but for NGC 3628W. The velocity range is from 609.8 to 1063.2 km s−1 in both panels. The contour levels are set to (3, 6, 9, 12, 15, 18, 21, 30, 40, 50, …, 160) × 0.048 Jy beam−1 km s−1. |
| In the text | |
|
Fig. B.1. HI data exclusively from the Arecibo telescope with 3 |
| In the text | |
Current usage metrics show cumulative count of Article Views (full-text article views including HTML views, PDF and ePub downloads, according to the available data) and Abstracts Views on Vision4Press platform.
Data correspond to usage on the plateform after 2015. The current usage metrics is available 48-96 hours after online publication and is updated daily on week days.
Initial download of the metrics may take a while.