Fig. 10.
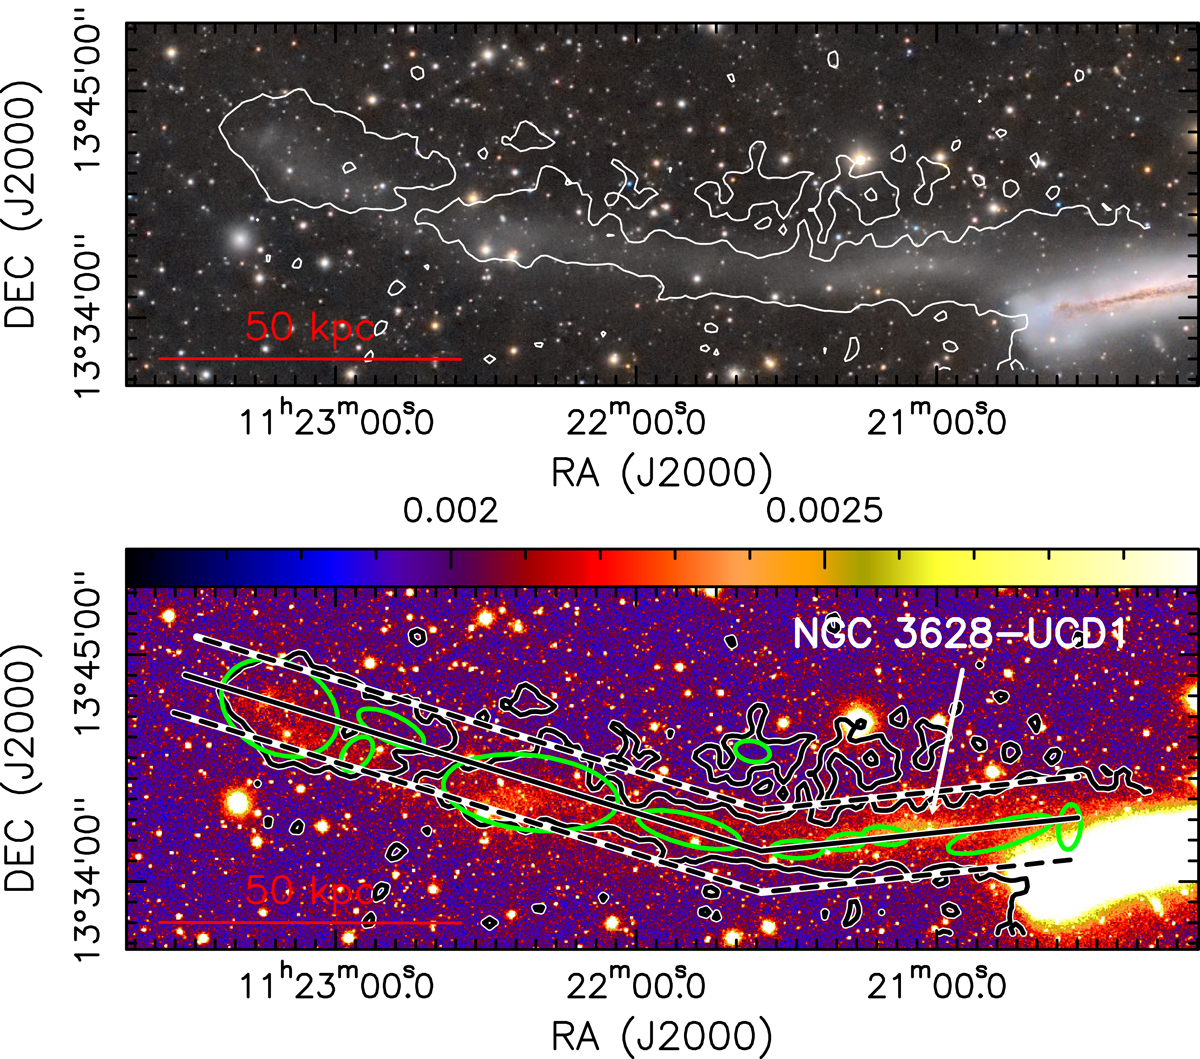
Download original image
Full-color optical image of the plume (top panel). The luminance-filter optical image of the plume (see Sect. 2.2) excluding the pixels with uncalibrated flux larger than 0.003 (lower panel). The 3-σ (3 × 0.027 Jy beam−1 km s−1) H I contours in the two panels are the same as those in the lower panels in Fig. 4. The green ellipses demonstrate the condensations identified in the plume. The black solid and dashed lines in the lower panel show the loci and the averaged width for the radial profiles in Fig. 11.
Current usage metrics show cumulative count of Article Views (full-text article views including HTML views, PDF and ePub downloads, according to the available data) and Abstracts Views on Vision4Press platform.
Data correspond to usage on the plateform after 2015. The current usage metrics is available 48-96 hours after online publication and is updated daily on week days.
Initial download of the metrics may take a while.