Fig. 2.
Download original image
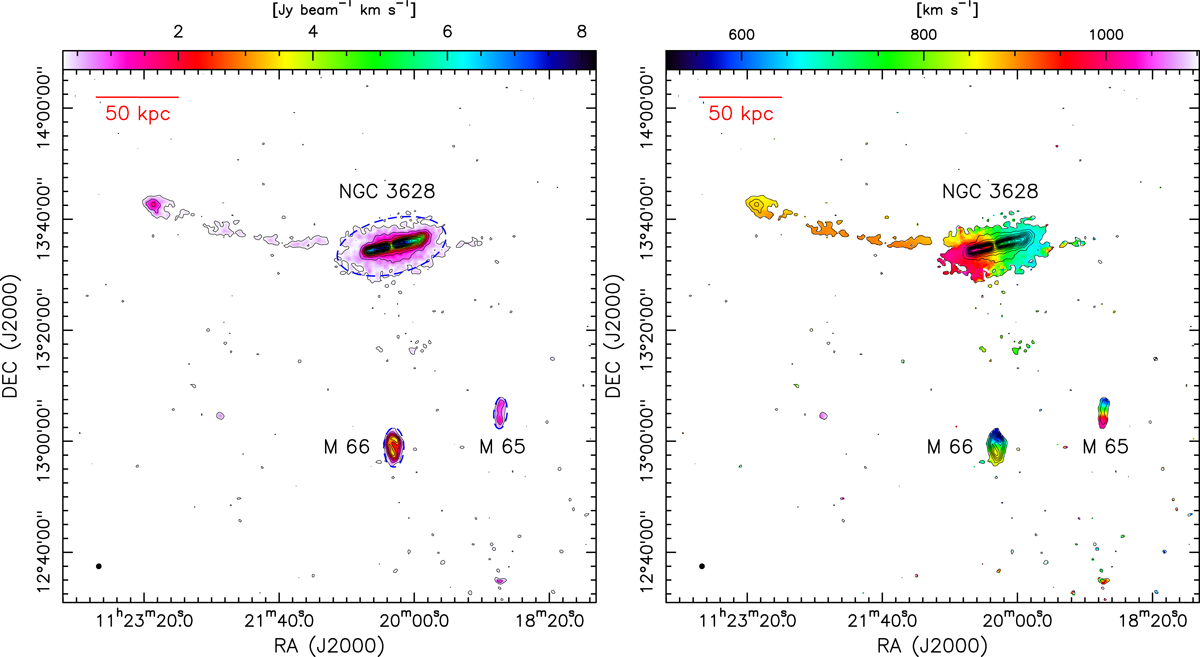
H I velocity-integrated emission (zeroth moment, left panel) and intensity-weighted velocity (first moment, right panel) maps. The integration range is from VHEL = 506.7 to 1125.1 km s−1 to cover all the H I features. In both panels the contour levels are set to (5, 15, 25, 35, …, 145)×0.055 Jy beam−1 km s−1. The galaxies NGC 3628, M 65, and M 66 are labeled in both panels and a tiny filled ellipse in the lower left shows the beam. The red line in the upper left illustrates the 50 kpc scale at a distance of 11.3 Mpc. Three blue dashed ellipses in the left panel demonstrate the main H I emission regions of the three galaxies.
Current usage metrics show cumulative count of Article Views (full-text article views including HTML views, PDF and ePub downloads, according to the available data) and Abstracts Views on Vision4Press platform.
Data correspond to usage on the plateform after 2015. The current usage metrics is available 48-96 hours after online publication and is updated daily on week days.
Initial download of the metrics may take a while.