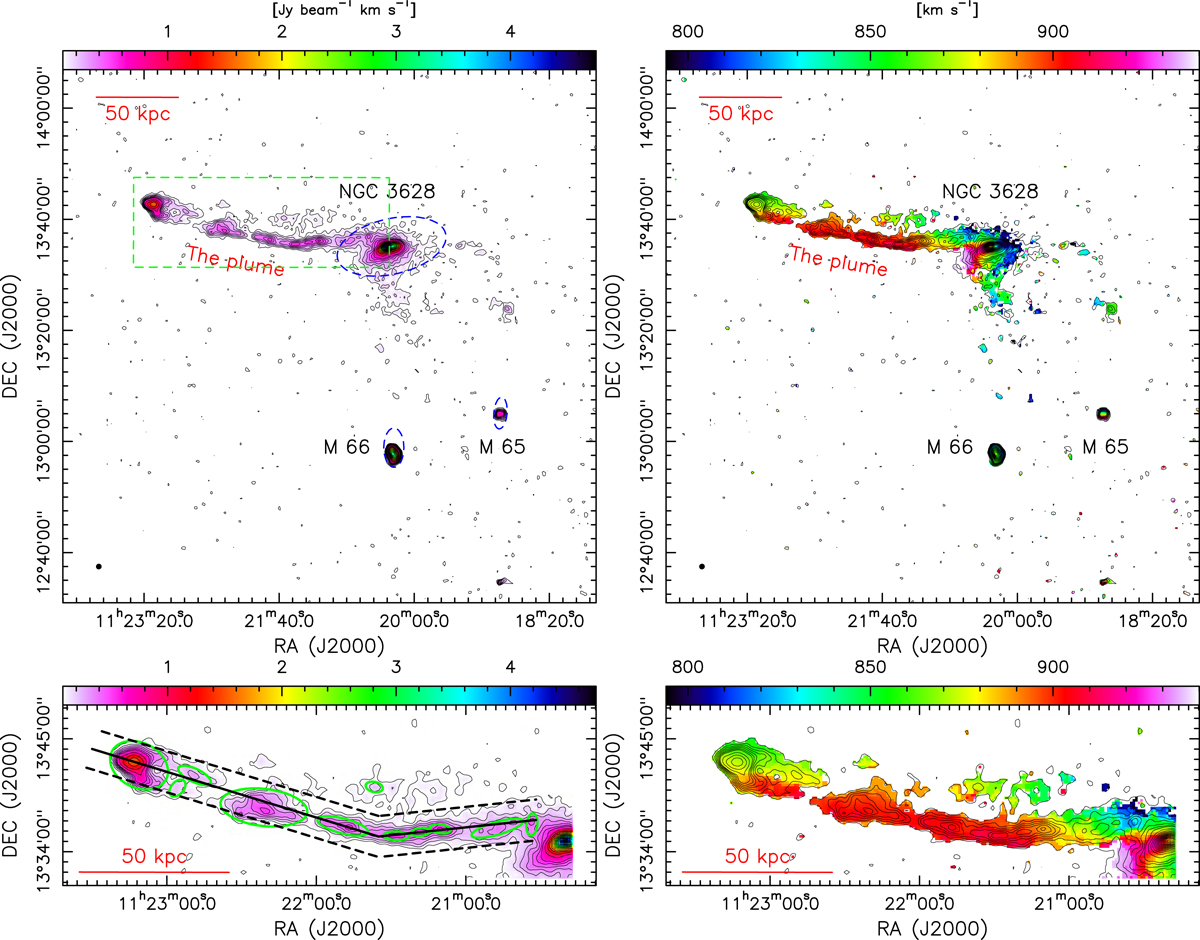
Fig. 4.
Download original image
H I velocity-integrated emission (zeroth moment) and intensity-weighted velocity (first moment) maps of the plume. Top two panels: in the left panel, contours and also the color image show the zeroth moment map. The integration range is from VHEL = 795.3 to 939.5 km s−1. The contour levels are set to (3, 6, 9, 12, 15, 18, 21, 30, 40, 50, 60, …, 180) × 0.027 Jy beam−1 km s−1. The green ellipses demonstrate the clumps detected in the plume. Right panel: color image shows the first moment map. The contours overlaid are the same as the ones in the left panel. The galaxies NGC 3628, M 65, M 66, and NGC 3628E (the plume) are also labeled in both panels and a filled ellipse in the lower left shows the synthesized beam. The red line in the top left illustrates the 50 kpc scale at a distance of 11.3 Mpc. The three blue dashed ellipses demonstrate the locations of the three galaxies. Bottom two panels: same as the top two panels but zooming into the region that is illustrated by the green dashed rectangle in the top left panel. The black solid and dashed lines in the lower left panel show the loci and the averaged width of the radial profiles in Fig. 11.
Current usage metrics show cumulative count of Article Views (full-text article views including HTML views, PDF and ePub downloads, according to the available data) and Abstracts Views on Vision4Press platform.
Data correspond to usage on the plateform after 2015. The current usage metrics is available 48-96 hours after online publication and is updated daily on week days.
Initial download of the metrics may take a while.