| Issue |
A&A
Volume 658, February 2022
|
|
|---|---|---|
| Article Number | A121 | |
| Number of page(s) | 12 | |
| Section | Interstellar and circumstellar matter | |
| DOI | https://doi.org/10.1051/0004-6361/202141413 | |
| Published online | 08 February 2022 | |
The impact of the presence of water ice on the analysis of debris disk observations
Institut für Theoretische Physik und Astrophysik, Christian-Albrechts-Universität zu Kiel,
Leibnizstr. 15,
24118
Kiel,
Germany
e-mail: tstuber@astrophysik.uni-kiel.de
Received:
28
May
2021
Accepted:
14
November
2021
Context. The analysis of debris disk observations is often based on the assumption of a dust phase composed of compact spherical grains consisting of astronomical silicate. Instead, observations indicate the existence of water ice in debris disks.
Aims. We quantify the impact of water ice as a potential grain constituent in debris disks on the disk parameter values estimated from photometric and spatially resolved observations in the mid- and far-infrared.
Methods. We simulated photometric measurements and radial profiles of debris disks containing water ice and analyzed them by applying a disk model purely consisting of astronomical silicate. Subsequently, we quantified the deviations between the derived and the true parameter values. As stars in central positions we discuss a β Pic sibling and main-sequence stars with spectral types ranging from A0 to K5. To simulate observable quantities we employed selected observational scenarios regarding the choice of wavelengths and instrument characteristics.
Results. For the β Pic stellar model and ice fractions ≥50% the derived inner disk radius is biased by ice sublimation toward higher values. However, the derived slope of the radial density profile is mostly unaffected. Along with an increasing ice fraction, the slope of the grain size distribution is overestimated by up to a median factor of ~1.2 for an ice fraction of 90%. At the same time, the total disk mass is underestimated by a factor of ~0.4. The reliability of the derived minimum grain size strongly depends on the spectral type of the central star. For an A0-type star the minimum grain size can be underestimated by a factor of ~0.2, while for solar-like stars it is overestimated by up to a factor of ~4–5. Neglecting radial profile measurements and using solely photometric measurements, the factor of overestimation increases for solar-like stars up to ~7–14.
Key words: circumstellar matter / interplanetary medium / infrared: planetary systems / submillimeter: planetary systems / methods: numerical
© ESO 2022
1 Introduction
Debris disks are optically thin, gas-poor circumstellar distributions of dust around main-sequence stars and brown and white dwarfs; the dust is continuously produced in collisional cascades initiated by colliding parent planetesimals (for recent reviews of debris disks see Matthews et al. 2014; Hughes et al. 2018; Wyatt 2020). While debris disks were originally discovered in unresolved images by their infrared excess (Aumann et al. 1984; Aumann 1985), today spatially resolved images of those systems are available. Paired with spectral energy distributions (SEDs) they allow us to break degeneracies in the analysis of debris disk observations and to constrain both the geometrical structure and properties of the dust distribution.
At mid-infrared to millimeter wavelengths, where we trace the thermal emission of the dust, recent advancements in the field have become possible, thanks particularly to the Spitzer Space Telescope (Spitzer; Werner et al. 2004), the Herschel Space Observatory (Herschel; Pilbratt et al. 2010), and the Atacama Large Millimeter/submillimeter Array (ALMA; Kurz et al. 2002). At shorter wavelengths, where we trace the stellar light scattered by the dust, using high-contrast imaging instruments such as the Hubble Space Telescope (HST), the Gemini Planet Imager (GPI; Macintosh et al. 2006), the Subaru Coronagraphic Extreme Adaptive Optics (SCExAO; Minowa et al. 2010; Jovanovic et al. 2015), and the Spectro-Polarimetric High-contrast imager for Exoplanets REsearch (SPHERE; Beuzit et al. 2019) helped to extend our knowledge.
Among other parameters such as dust grain porosity (Kirchschlager & Wolf 2013; Brunngräber et al. 2017), the chemical composition of the dust grains defines their absorption and scattering characteristics, and thus has a major impact on the appearance of a debris disk. However, to infer the dust composition from observations is difficult for various reasons. For example, characteristic dust features are found in the infrared, such as the prominent 10 or the 69 μm feature (e.g., de Vries et al. 2012) of silicate. However, debris disks frequently possess an inner cavity with a typical size of several astronomical units (e.g., Jura et al. 1998; Moro-Martin et al. 2008, and references therein), and thus only small amounts of warm dust could produce these spectral features. Furthermore, the systems are often faint sources, which makes high-resolution spectroscopy of the scattered light and thermal emission radiation difficult. Apart from the silicate components, which are often modeled all together by the artificial material astronomical silicate (hereafter silicate; Draine & Lee 1984; Draine 2003), collisional debris can be composed of various other chemical species, including water ice (Lisse et al. 2012). Water ice is expected to be present in debris disks for several reasons. In protoplanetary disks, which are the direct progenitors of debris disks, water ice has been confirmed observationally (Pontoppidan et al. 2014, and references therein), and we know that planetesimals in our own Solar System can contain substantial amounts of water ice (ibid.). Direct observations of debris disks also suggest the presence of water ice. Around HD 181327 Chen et al. (2008) found a broad emission peak at 60–70 μm, potentially caused by crystalline water ice. The analyses of several further debris disk observations favor a water ice–silicate mixture (e.g., Löhne et al. 2012; Lebreton et al. 2012; Morales et al. 2013, 2016). However, there is currently no solid evidence for water ice in a debris disk. A possible explanation is given by the effect of photosputtering by ultraviolet (UV) photons (Grigorieva et al. 2007), which might remove water ice from the grain surfaces within a short timescale. However, as we do not have secured evidence of this effect, we do not consider it in this study. If water ice is present in debris disks, its prominent ~ 3 μm spectral feature will potentially be observable with the James Webb Space Telescope (JWST; Gardner et al. 2006; Kim et al. 2019).
In this study we evaluate the impact of water ice on the analysis of typical debris disk observations. Our approach is to simulate synthetic observations of ice-containing debris disks with a setup strongly motivated by real observations: photometricmeasurements and radial profiles extracted from spatially resolved images at wavelengths ranging from the mid-infrared to the millimeter regime. Our dust model employs ice–silicate mixture grains; the ice can undergo sublimation, which produces vacuum inclusions making the grain porous. Subsequently, we analyze these synthetic observations assuming compact silicate dust grains and compare the derived parameter values with the known true values (Sect. 2). Debris disk parameters are then considered: the inner disk radius, the slope of the radial density and grain size distribution, the minimum grain size, and the total disk mass within the considered grain size interval. We present the results for dust configurations around a star comparable to β Pic (Sect. 3.1) and investigate the impact of the spatial resolution by varying the distance to the debris disk system (Sect. 3.2). Subsequently, we explore the impact of the spectral type (A0 to K5, Sect. 3.3). Finally, we summarize our results and relate them to observational analyses from the literature (Sect. 4).
2 Methods
2.1 General procedure
To address the general question outlined in Sect. 1, our goal is to quantify the bias in the quantitative estimation of values of selected debris disk parameters if the presence of water ice (hereafter ice) is ignored. For this purpose we chose a procedure similar to that applied by Brunngräber et al. (2017) to study the influence of dust grain porosity on the analysis of debris disk observations:
- (i)
Simulation of ice-containing debris disks; computation of SEDs and spatially resolved images;
- (ii)
Simulation of synthetic observations
SEDs: addition of artificial noise
Images: convolution with an instrument beam, extraction of radial profiles, addition of artificial noise;
- (iii)
Simulation of reference debris disks consisting of pure compact silicate grains, computation of SEDs, extraction of radial profiles;
- (iv)
Fitting of the synthetic observations (ii) using the reference observations (iii);
- (v)
Comparison of the best-fit parameter values (iv) with the correct ones (i).
In the following the underlying debris disk model as well as the modeling and fitting approach are outlined.
2.2 Grain properties and water ice model
Ice appears in multiple crystalline and amorphous phases depending on the environmental conditions. All phases are characterized by different physical characteristics, such as their optical properties. For example, the ice condensed onto grains in a cold interstellar or solar nebular environment is supposed to be amorphous. However, embedded in planetesimals and exposed to frictional and/or radioactive heating it can transform into a crystalline phase (see Petrenko & Whitworth 2002, for a thorough review about ice physics). In our study we applied crystalline water ice with a density of ρice = 1.0 g cm−3 (e.g., Kobayashi et al. 2008, 2010) at a temperature of 55 K as a representative temperature in a cold debris disk.
We employed a mixture of ice and silicate (hereafter ice-mixture), for which we used the data sets of wavelength-dependent complex refractive indices compiled by Kim et al. (2019; see their Sect. 2 for a detailed description of the applied approach to merge the individual data sets), containing optical ice data of different wavelength regimes using the results of Li & Greenberg (1998), Potapov et al. (2018), Curtis et al. (2005), Reinert et al. (2015), Häßner et al. (2018), and Warren (1984). In their study, Kim et al. (2019) obtained optical properties of nine ice-mixtures with an ice volume fraction  ranging from 0.1 to 0.9 in steps of 0.1 by using the Maxwell–Garnett rule of effective medium theory (EMT; Garnett 1904) with ice as the inclusion and silicate as the matrix. As complex refractive indices of silicate they used the data from Draine (2003). Likewise, we used this silicate data for the reference disks consisting of compact silicate grains. In this study we employed ρsil = 3.8 g cm−3 as the bulk density of silicate. Furthermore, we assumed all grains to be spherical and used the Mie (Mie 1908) scattering tool miex (Wolf & Voshchinnikov 2004) to compute the required optical properties, such as their wavelength-dependent cross sections.
Once released from a large parent planetesimal, the dust grains are exposed to a vacuum and stellar radiation, which may depletethe ice and modify its radial distribution. When exposed to stellar radiation, a grain heats up to an equilibrium temperature. Following Kim et al. (2019), we assumed a sublimation temperature of the ice inclusions of 105 K. If the equilibrium temperature of an ice-containing grain exceeded the sublimation temperature, we assumed the leftover to be a porous silicate grain; that is, the ice is assumed to be replaced by a vacuum. The porosity  , defined as the volume fraction of a vacuum, equals the ice fraction
  of the precursor grain. The remaining porous silicate grain then has different optical properties, and thus different absorption and emission characteristics. Therefore, it settles to a different equilibrium temperature than its precursor grain. We derived the complex refractive indices of porous silicate as mixtures of silicate and a vacuum applying the EMT mixing rule.
Highly energetic UV photons have the potential to deplete ice directly via photosputtering (or photodesorption). Grigorieva et al. (2007) find that around β Pic only grains ≳20 μm can be at least partially icy at a distance ≥40 AU from the star. However, the authors note that their results should be treated with care as they have not used full-scale collisional evolution simulations. Implementing their findings in our model might underestimate the importance of ice in young and collisionally active debris disks. Therefore, we decided to neglect UV photosputtering in this study. Thus, the results of this study are primarily applicable to collisionally active debris disks. The other extreme case, in which grains cannot retain their ice in the presence of UV photosputtering and only porous grains remain, has been considered by Brunngräber et al. (2017).
The relative strength of the radiation pressure of the incident radiation onto a dust grain can be described by the β-factor, defined as the ratio of radiation to gravitational force (Zook & Berg 1975; Burns et al. 1979). We compute β by taking the wavelength-dependence of the radiation pressure efficiency into account (Kirchschlager & Wolf 2013)
 (1)
(1)
with the gravitational constant G, the speed of light in a vacuum c, the stellar radius R⋆, the stellar mass M⋆, the stellar effective temperature T⋆, the grain radius a, the bulk densityρ, the wavelength λ, the stellar spectrum Jλ (see Sect. 2.4), and the wavelength-dependent radiation pressure efficiency factor Qpr.
Assuming that the grains are released on a circular orbit, those with β ≥ 0.5 become unbound, leave the system on parabolic or hyperbolic orbits (see, e.g., Zook & Berg 1975; Krivov et al. 2006), and are removed from the simulations. The specific value of the blow-out grain size abo, below which all grains get blown out, is individual for each of the two materials of ice-mixture and porous silicate, denoted by  and
and  , respectively. We assume the ice-mixture grains to reach thermal equilibrium before they get blown out of the system. Thus, if the grain temperature is above the ice sublimation temperature, first the ice is considered sublimated and second β is calculated for the porous leftover. For dust around a star similar to β Pic (see Sect. 2.4) the blow-out grain sizes for both the ice-mixture and porous silicate grains are displayed in Fig. 1.
The grain size distribution is modeled as a power law  , ranging from the minimum to maximum grain size, amin to amax, with
  being the number of particles in the interval
 ![$\left[a, a + \mathrm{d} a \right]$](/articles/aa/full_html/2022/02/aa41413-21/aa41413-21-eq9.png) . A steady state collisional cascade would produce a size distribution with γ = 3.5 (Dohnanyi 1969). Distinguishing between objects in the strength regime (diameter D ≲ 0.1 km) and objects in the gravity regime (D ≳ 0.1 km) leads to values of γ ~ 3–4 (Matthews et al. 2014). We adopted this parameter range and explored it in this study. By using a simple power law for the grain size distribution, we neglect its wavy pattern caused by the blow-out of small grains by radiation pressure (Campo Bagatin et al. 1994; Thébault & Augereau 2007; Wyatt et al. 2011) and effects caused by the Poynting–Robertson drag (Poynting 1904; Robertson 1937; Wyatt & Whipple 1950; Burns et al. 1979). For amin we used a fixed value of 2 μm, which is smaller than the blow-out grain sizes of our ice-mixture and porous silicate grains
. A steady state collisional cascade would produce a size distribution with γ = 3.5 (Dohnanyi 1969). Distinguishing between objects in the strength regime (diameter D ≲ 0.1 km) and objects in the gravity regime (D ≳ 0.1 km) leads to values of γ ~ 3–4 (Matthews et al. 2014). We adopted this parameter range and explored it in this study. By using a simple power law for the grain size distribution, we neglect its wavy pattern caused by the blow-out of small grains by radiation pressure (Campo Bagatin et al. 1994; Thébault & Augereau 2007; Wyatt et al. 2011) and effects caused by the Poynting–Robertson drag (Poynting 1904; Robertson 1937; Wyatt & Whipple 1950; Burns et al. 1979). For amin we used a fixed value of 2 μm, which is smaller than the blow-out grain sizes of our ice-mixture and porous silicate grains  and
and  for all values of
  and
and  (see Fig. 1). The maximum grain size amax has a negligible impact on the appearance of a debris disk because the small grains contribute the most to the net surface of the disk for the applied steep size distributions. Therefore, we set a fixed value of amax = 1 mm, a value often used in observational analyses (e.g., Löhne et al. 2012; Morales et al. 2013, 2016; Pawellek et al. 2014; Rodigas et al. 2015). Eventually, the absolute number of grains as a function of position (see Sect. 2.3), grain size, and chemical composition is determined by the total dust mass for which we choose an intermediate value of Mtot = 10−8 M⊙ (e.g., Greaves et al. 2005, and references therein).
To determine the blow-out grain size abo from synthetic observations, we need the minimum grain size amin to be a free parameter for the reference compact silicate disk sample. We considered the interval amin= 0.1–20 μm, sampled by 40 logarithmically spaced grid values. This interval covers all possible blow-out grain sizes in our simulations (see Fig. 1). Furthermore, the parameter grid has to remain unaltered by the blow-out of grains by radiation pressure. Therefore, we artificially forbid the blow-out of grains by radiation pressure for the simulation of the reference disks.
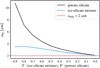 |
Fig. 1 Blow-out grain sizes abo of grains consisting of an ice-mixture or porous silicate for different volume fractions of ice
|


2.3 Debris disk model and parameter space
To simulate observable quantities of debris disks, we used an improved version of the tool Debris disks around Main-sequence Stars (DMS; Kim et al. 2018). It is based on the assumption of an optically thin dust configuration to compute SEDs and intensity maps of the thermal dust emission and scattered stellar radiation.
We considered debris disks in face-on orientation. The dust is distributed in a wedge-like structure, restricted by an inner and outer disk radius, Rin and Rout, respectively, and a half opening angle with a fixed value δ = 5°. The particle number density follows a power law  , with r denoting the distance from a grain to the central star.
We varied the inner disk radius Rin from 10–50 AU, corresponding to the case of cold debris disks. Usually, the outer disk radius Rout deduced from debris disk observations is set by the sensitivity of the observing instrument. We set a fixed cutoff at Rout = 250 AU. The exponent α, describing the radial density profile, usually ranges from values of α = 1 for a stationary outflow of unbound grains (Lecavelier Des Etangs et al. 1998) to α = 2.5 for a transport-dominated disk, (Strubbe & Chiang 2006; Krivov et al. 2006). Krivov et al. (2006) note that a recent large collisional event or planets orbiting within the dust distribution could further steepen the slope. Therefore, we considered values of α in the range 1–3.
We examined 20 values for each of the free disk parameters of the synthetic observations. They are linearly spaced for the parameters α and γ (see Sect. 2.2); instead, they are logarithmically spaced for the inner disk radius Rin. The parameter space for the reference silicate disks, hence the fit parameter space, should be larger than that of the synthetic observations to avoid artificial restrictions during the fitting process. Therefore, we defined the parameter space of the reference models to be that of the synthetic observations and further extended it by two values into the high and low regime using the same spacing. Thus, the fit parameter space contains 24 values for each parameter and is a strict superset of the space of the synthetic observations. All parameter spaces are summarized in Table 1.
Parameter space.
2.4 Central star model
Most of the spatially resolved debris disks are located around A-type stars1. As the central star we modelled a star similar to β Pic, an A6V star with an effective temperature of Teff = 8052 K (Gray et al. 2006) located at a distance of 19.44 pc 2 from the Solar System (van Leeuwen 2007). We applied a stellar mass of 1.75 M⊙ (Crifo et al. 1997; Kervella et al. 2004) and a stellar radius of 1.732 R⊙ (Kervella et al. 2004). For the stellar spectrum Jλ we used a HiRes spectrum from the Göttingen Spectral Library 3 (Husser et al. 2013), calculated for an effective temperature and a logarithmic surface gravity of T⋆ = 8000 K and ![$\log{g} = 4.0\ \left[\mathrm{cgs} \right]$](/articles/aa/full_html/2022/02/aa41413-21/aa41413-21-eq15.png) , respectively.To compute scattered light maps at wavelengths exceeding the maximum wavelength of the synthetic spectrum (5.5 μm), the stellar spectrum was extrapolated using the Planck function corresponding to the effective temperature of the star.
, respectively.To compute scattered light maps at wavelengths exceeding the maximum wavelength of the synthetic spectrum (5.5 μm), the stellar spectrum was extrapolated using the Planck function corresponding to the effective temperature of the star.
In Sect. 3.3 we investigate additional spectral types from A0 to K5. The corresponding values of effective temperatureand logarithmic surface gravity are listed there (see Table 3).
2.5 Simulated observations
We considered selected observing scenarios in which the choices of wavelengths and instrument characteristics are motivated by real debris disk observations. To mimic the SEDs we selected nine wavelengths ranging from the atmospheric N band to 1.3 mm. These observing wavelengths and the corresponding astronomical instruments are typical for existing debris disk observations, and have played an important role in advancing the field over the last decades (see Table 2). To keep the results of this study independent of specific instrument characteristics, and thus generally applicable, we refrained from applying specific sensitivity limits. Furthermore, we did not integrate over the transmission curves of the respective instruments and obtained the individual photometric data points for distinct wavelengths. Likewise, to keep the study applicable to various debris disk systems with different dust masses, we neglected the direct flux of the central star to avoid the influence of the specific dust to star flux ratio.
To simulate observations of spatially resolved images, we used the characteristics of the instruments PACS (Poglitsch et al. 2010) on Herschel, with which the major debris disk surveys DEBRIS (Matthews et al. 2010) and DUNES (Eiroa et al. 2010, 2013) were performed, and ALMA, the state-of-the-art instrument regarding resolving power in the millimeter–submillimeter regime (see, e.g., MacGregor et al. 2013, 2017; Dent et al. 2014; Marino et al. 2018). We used two wavelengths for each instrument: 70, 160 (Herschel/PACS), and 850, 1300 μm (ALMA). We convolved the images with an instrument and wavelength-dependent circular Gaussian. Subsequently, we extracted radial profiles sampled by multiples of the full width at half maximum (FWHM) of the instrument beam, starting at the image center (see Appendix A for a detailed description of the simulation of these radial profiles). We assumed the disks to always have radial profile data in all four wavelengths.
In the synthetic observations of ice-containing debris disks we introduced artificial uncertainties in the final data products: for each data point we set up a normal probability distribution with the precise value of the data point as mean and 10% of it as standard deviation. Subsequently, we produced a new, now final, data point from the probability distribution with a random number generator. For the later data analysis (see Sect. 2.6) we assumed the final data points of the synthetic observations to have an uncertainty value of 10%, denoted by σ. Doing so we slightly under- or overestimated the uncertainty for data points which became lower or higher than their respective true values due to the addition of noise. Nonetheless, with this method we obtained data points that scatter around their respective true values in a normally distributed fashion.
Considered observing wavelengths.
2.6 Fitting approach
For each of the ice-containing disks we searched for the pure silicate disk within the reference sample whose observables mimic most closely those of the ice-containing model. We computed the weighted squared deviation χ2 and identified the best-fit reference model as the one with the smallest value of χ2. Beforehand, the reference observables have to be scaled with the total disk mass Mtot to deviate the least from the synthetic ones. This step can be incorporated into the calculation of the weighted squared deviation as
 (2)
(2)
with the values of the synthetic observation xi, their weights wi (see explanation below), the mass scaling factor  , and the values of the reference observation
  . To find the mass scaling factor
  for which the value of χ2 is minimal, this equation can be differentiated with respect to
  and set to zero. The resulting equation can be uniquely solved:
 (3)
(3)
By combining Eqs. (2) and (3), the value of χ2 for each model fit is calculated.
To disentangle the influence of ice on different observables we searched for the best-fit model separately using the SED, radial profiles and a combination of the two. Regarding weights, we did not consider instrument specific uncertainties. For the individual analysis of the SED and radial profiles, the weights wi are defined only by the uncertainties of the data points  . For the combination of the SED and radial profiles we used an additional weight causing the two entire data sets to be equally weighted, regardless of how many data points they possess individually. The SED consists of 9 data points (see Table 2), the radial profiles all together consist of 27 data points (see Table A.1), thus
  and
and  .
.
As a sanity check for our fit routine we used the simulated observables of reference silicate disk models themselves as synthetic observations. The radial profile fit always results in the correct model parameters, even if simulated noise is added. The SED fit does so only without noise; with noise the fit results can deviate from the correct parameters because the SED is rather insensitive to small changes in disk parameters, and some parameter changes are degenerate in their effects on the SED.
3 Results
3.1 Reliability of derived debris disk parameters
We define fparam as the ratio of the best-fit value of a given parameter to its correct (“true”) value. Thus, we can distinguish between the qualitatively different outcomes:
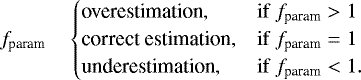 (4)
(4)
We obtained 8000 (= 203) best-fit parameter sets for each ice fraction  , and evaluated them in a statistical manner to identify trends. For each value of
  and disk parameter, we derived the median fparam, denoted by
  . Furthermore, we derived the 0.16 and 0.84 quantiles, defining the interval around the median value
  containing 68% of the values offparam, as a measure of the scatter in the estimated parameter values (see Fig. 2). In the following we discuss the fitting results of the individual parameters.
3.1.1 Inner disk radius Rin
Fitting to the SED, the quantity Rin is preferentially underestimated for ice fractions  . For decreasing ice fractions the median value
  increases until it indicates a match between the fitted and the true value for
  . At the same time, the scatter of results and the level of overestimation of the inner disk radius Rin increases with decreasing value of
  .
.
Based on the fit to radial profiles, thus incorporating geometrical information, we find the median value to be  and no synthetic observations resulting in an underestimation of the inner disk radius within the 68% interval for all ice fractions
  . Nonetheless,for
  the fractionof models with an overestimated inner disk radius increases along with
  . This can be explained as follows. For disk models with an inner disk radius of ≲ 25 AU, the temperature of grains with radii of ~5 μm up to several hundred μm exceeds the ice sublimation temperatureinside ~20–25 AU (exact values dependent on the ice fraction
  ). For all four wavelengths at which we investigate radial profiles (see Table A.1), it holds that the remaining porous grains emit less thermal radiation in the respective wavelength than ice-mixture grains would, leading to a pronounced decrease in the flux level. The flux deficit increases with wavelength and ice fraction
  . The fitting process, based on the reference model with a smooth flux radial profile, favors configurations with a larger inner disk radius to adapt to the flux deficit in close-in regions.
When comparing the results of combining the SED and radial profiles in a single fit to those of the pure radial profile fit, we see that the scatter in results is reduced for  , but not for
  .
.
3.1.2 Radial density distribution exponent α
Fitting to the SED, the radial density decrease is mainly overestimated for ice fractions of  . For smaller ice fractions the estimations are better; for
  the median value
  except for
  , but there the deviation from one is small. The scatter in results is generally large, even for the lowest values of
  . As expected for the determination of a geometrical parameter, the fit to radial profiles performs better; we find
  for all ice fractions
  , with only a small scatter in results for
  . When combining SED and radial profile information, the scatter in results increases slightly for
  .
.
3.1.3 Grain size distribution exponent γ
We see the same trend in the results of fitting to the SED and fitting to the radial profiles. Except for the SED case with low ice fractions 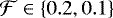 , γ gets strictly overestimated. The mismatch is the largest with a median value of
  for the highest ice fraction
  and decreases along with it. Therefore, for a higher value of
  a higher fraction of small grains is needed to reproduce the synthetic observations. The scatter in results for ice fractions
  is almost the same for the fit to the SED and to radial profiles; for lower ice fractions
  fitting to the radial profiles results in slightly smaller scattering.
The above trend is similar to the one Brunngräber et al. (2017) find when investigating the effect of porous silicate grains. At first glance it appears, that this finding can be explained by the presence of porous silicate in the inner disk regions where ice is sublimated. However, this explanation does not imply that the impact of ice is negligible. First, when artificially suppressing ice sublimation during the simulation, the fitting results for the exponent of the grain size distribution γ remains almost unaffected. The same is true in the case of stars with later spectral types (see Sect. 3.3), which are not luminous enough to sublimate significant amounts of ice. Thus, we conclude that the above trend has its origin in the substitution of some amount of silicate by an optical medium that is less optically active (in the respective wavelength range) and dense, be it a vacuum orice. Therefore, the fit using pure silicate as the grain material assumes the grains to be too massive. This explanation coincides with our finding that ice-mixture grains lead to a smaller overestimation of the grain size distribution exponent γ than porous silicate grains do (see lower right panel of Fig. 3 in Brunngräber et al. 2017) because ice is optically active and massive, while a vacuum is neither.
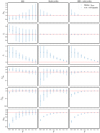 |
Fig. 2 Statistical results of the fitting process of 8000 model parameter sets based on the SED (left), the radial profiles (middle), and the combination of the two (right). The blue crosses indicate the median factor
|


3.1.4 Minimum grain size amin
From the fit we obtained a single estimation of the minimum grain size amin. First we compared it to the blow-out grain size of the ice-mixture  and derived the factor
  . As shown in Fig. 1, ice-mixture grains of the size
  are the smallest grains in the disks as
  for all ice fractions
  . In the median the results from fitting to the SED overestimate the parameter amin for all values of
  , at most by a factor
  for
for  . While
  decreases along with the value of
  , the scatter of results does not. The results of the fit to radial profiles for ice fractions
  are similar to those of the fit to the SED. However, for large ice fractions
  they show a completely different behavior; they underestimate the minimum grain size
  with a very large scatter. The possibility that the fit favors a smaller minimum grain size amin to compensate the overestimation of the inner disk radius Rin can be ruled out. In a simulation with suppressed sublimation the fitting results for Rin scatter less for a given ice fraction
  , while those of
  are barely affected. The behavior for
  can be explained by the fact that high ice fractions
  cause the radial profiles of the ice-containing disks to become flatter compared to those for lower ice fractions. The fit routine, working only with pure silicate disks, cannot vary the dust material to adapt to this. However, within the chosen model setup (i.e., defined by the properties of the central star, disk geometry, observing wavelengths, dust material), decreasing the minimum grain size amin in the silicate disks has the same effect as decreasing the slope of the radial profiles. Therefore, to fit the radial profiles of the ice-containing disks that possess the highest ice fractions
  the fit is biased toward smaller values of amin, that is, an underestimation of that parameter.
Contrary to the determination of all other disk parameters, here the combination of the two data sets, SED and radial profiles, has a major effect. Compared to the fit results of the single data sets the scatter of parameter estimations decreases for all ice fractions  and the median value
  even for the highest values of
  .
.
Then we compared the estimated minimum grain size amin to the blow-out grain size of porous silicate  and obtained
  . We find that the fit to the SED for ice fractions of
  and the fit to radial profiles for
  are biased toward the size of the smallest porous grains, instead of favoring the size of the smallest ice-mixture grains. For the fit to the combined data this is only the case for ice fractions of
  , where the difference between the two blow-out grain sizes
  and
and  is already small (see Fig. 1).
3.1.5 Total disk mass Mtot
A clear trend with ice fraction  is apparent for the results from fitting to the SED and to the radial profiles. While the median value
  for ice fractions
  , a further increase in
  results in an underestimation of the disk mass Mtot. Thus, the reference disks require a lower mass than the ice-containing ones to reproduce a similar flux. Here, three effects are important. The first causes an underestimation of the total disk mass, while the second and third cause an overestimation, effectively canceling each other out. The higher the ice fraction
  , respectively porosity
  , the stronger all three effects are.
First, as the compact silicate grains have a higher mass than equally sized ice-mixture and porous silicate grains, a disk consisting of compact silicate grains requires more mass to possess the same number of grains, thus the same total cross section, as a disk consisting of the more lightweight ice-mixture or porous silicate grains. The discrepancy increases with increasing ice fraction  and porosity
  .
.
Second, the higher the value of  , the higher the fitting results for the quantity γ, hence the steeper the grain size distribution (see Fig. 2 and earlier in this section). While the small grains contribute only a minor fraction to the disk mass, they contribute the most to the total cross section, thus to the emitted and scattered radiation. A disk with a steeper size distribution possesses a higher fraction of small grains than a disk with a shallower size distribution. Therefore, to produce the same flux level a disk with a steeper size distribution requires less mass than a disk with a shallower distribution.
Third, as compact silicate grains are hotter and emit more thermal radiation than ice-mixture and porous grains at the same radial distance from the central star, a disk consisting of compact silicate grains requires fewer grains, thus less mass, to produce the same flux level as a disk consisting of ice-mixture or porous silicate grains.
For ice fractions of  the effects compensate for each other, leading to a correct estimation of the total disk mass. However, toward larger values of
  the latter two effects dominate and the fitting results underestimate the disk mass. The degree of underestimation from fitting to the SED is significantly stronger than that from fitting to radial profiles, for instance, with
  for the fit to SED and
  for the fit to radial profiles for an ice fraction of
  . Furthermore, the scatter of fitting results based on the SED is generally larger than that based on the radial profiles, even for low ice fractions. Combining the two data sets increases the scatter of the results from fitting solely to radial profiles.
3.1.6 General evaluation
The results from fitting to the SED are degenerate for ice fractions of  . The inner disk radius Rin is underestimated, while at the same time the slopes of the radial density distribution α and the grain size distribution γ are overestimated. A smaller value of Rin allows grains closer to the central star, a larger value of α increases the grain number density in those close-in regions, and a larger value of γ increases the amount of small grains compared to larger grains. Thus, the SED fitting favors disk models with smaller and hotter grains compared to the ice-containing disks to reproduce their SEDs. However, this effect is balanced by an overestimation of the minimum grain size amin, which sets the lower limit of the grain size distribution. Therefore, the SED fit results are degenerate between more grains in regions where they are hotter together with an increase in the abundance of smaller grains, and limiting the grain size distribution at the lower end.
Adding SED information to the radial profiles is only of major use for the determination of the minimum grain size amin. For all other debris disk parameters investigated the benefit is small or the scatter of results even increases. This behavior is dependent on the quality of the data (number of data points, noise level) and the chosen weighting of SED against radial profiles. For a worse quality of SED data, adding it to the radial profiles can be detrimental. Thus, when high-quality radial profiles are available, it can be advantageous to use SED data only when determining the respective disk parameters.
3.2 Different distances to the debris disk system
To date debris disks have been spatially resolved at different distances up to ~ 150 pc; roughly two-thirds are within 60 pc1. We now investigate the influence of the distance to the debris disk and thus the achievable spatial resolution on the parameter estimations. With the same setting as before, we set the distance to six different values from 10 to 60 pc. Along with the increasing distance to the debris disk system the spatial resolution of the images is decreasing and we extracted fewer data points for the radial profiles (see Sect. 2.5 and Appendix A). Due to the limited sensitivity of a given observing instrument, the signal-to-noise ratio depends on the brightness of a specific object. However, specific instrument characteristics are not considered in our analysis. Therefore, the analysis of our synthetic SEDs is not affected by the distance variation and we restrict our discussion here to the results of fitting to radial profiles (see Fig. 3).
In general, the scatter of results increases along with increasing distance, and thus decreasing spatial resolution. This occurs because with fewer data points the influence of the noise on the fit results increases. An exception is the result for α with  and d = 10 pc. Likewise, noteworthy are the results for the minimum grain size amin with distances of d ≥ 50 pc. For the ice fractions
 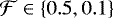 the scatter of results is larger, while for
  the median estimations
  ,
,  are smaller by one magnitude than those for distances d ≤ 40 pc. Furthermore, the median values correspond to the smallest grain size in the fit parameter space. We conclude that the determination of the minimum grain size amin is more sensitive to the spatial resolution of the radial profiles than the other disk parameters discussed. This behavior also translates into an increase in the total disk mass Mtot determined for an ice fraction of
  and a distance of d ≥ 50 pc. However, the estimation of the grain size distribution exponent γ is hardly affected. This coincides well with the fact that the fit to the SEDs, which can be seen as completely unresolved images, and the fit to radial profiles show similar results for this parameter (see Fig. 2).
3.3 Different stellar types
In addition to A-type stars, debris disks have been observed and resolved around various different stellar types. The central star has a major impact on its debris disk. It affects the dust temperature distribution, and thus the thermal emission of the grains, as well as the radial location beyond which ice can survive. Furthermore, the strengthof the gravitational field paired with the radiation pressure changes the blow-out grain size abo, allowing grains of different sizes within the system.
We performed the same investigation as for the β Pic sibling for a set of main-sequence stellar types from A0 to K5. The stellar properties were taken from Binney & Merrifield (1998). The simulated stars and their parameters are listed in Table 3. The corresponding values of stellar effective temperature T⋆ and logarithmic surface gravity logg are chosen as the nearest grid values in the Göttingen spectral library.
Due to the small radiation pressure, for central stars with spectral types of F0 and later either the blow-out grain size abo< 1 μm or there is no blow-out of grains at all. In an exploratory study Thebault & Kral (2019) investigated the presence and impact of those submicrometer grains in a cold debris disk composed of compact silicate around an A6V and a G2V star. They find for the latter that grains of the size a ≤ abo can account for more than 90% of the dust cross section. Apart from that there is little known about the fate of submicrometer grains around late-type stars (Matthews et al. 2014). However, except for the two shortest wavelengths in our synthetic SED, the relevance of such small grains in our study should be small. Therefore, for the ice-containing disks around F0 and later spectral types we set a lower border of the grain size distribution of amin = 1 μm. Furthermore, for these spectral types we also increased the maximum value of the fit parameter space of the minimum grain size amin to 30 μm.
Comparing the A5 and β Pic (A6) star, all estimations of disk parameters are very similar. Regarding the fit to radial profiles, for the A0 star a larger fraction of inner disk radii Rin are overestimated, and the overestimation is larger than for the A5 and β Pic star. Toward later spectral types the effect weakens for F5, and later it disappears, and the parameter Rin is estimated reliably by fitting to radial profiles for all ice fractions. This is as expected because the later the spectral type, the more the ice sublimation radii move inward until all grains retain their ice. Except for the A5 star, adding SED information has a negligible impact on the results; in some cases it can even increase the scatter of the distribution of the derived parameter values.
The exponent of the radial density distribution α can be constrained reliably by radial profiles regardless of the ice fraction  and spectral type. The only exception arises for the A0 spectral type and ice fractions
  . In this case the quantity α can be slightly underestimated, the strongest with a median factor of
  for
for  . This is again due to the sublimation of ice. The bright central star produces extended regions of porous silicate grains ranging outward, while in the outer disk regions the ice can still survive. As the porous silicate grains have a lower emissivity, the fit favors an overall flatter shape of the radial profile. Incorporating the SED data does not help to ease this problem.
In the results of all three fitting approaches the trends for the parameters γ and Mtot as seen for the β Pic case are almost constant with spectral type with only minor variances. Thus, the determination of these quantities is mostly independent from the amount of sublimated ice in the disk, hence the amount of porous silicate grains, and independent from the illuminating star.
Contrary to the other parameters, the determination of the minimum grain size amin is strongly influenced by the properties of the central star. In Fig. 4 the results of the estimations of  for the different spectral types are displayed. As stated previously,
  is the smallest grain size in the disks; for the A0 and A5 case it is set by abo, and for later spectral types it is fixed to 1 μm. Apart from a few exceptions, the later the spectral type, the larger the median value
  . Around F5 and later-type stars the results converge to a similar distribution.
Regarding fitting to the SED (see Fig. 4 left), the minimum grain size amin is underestimated for an A0 star and ice fractions  , while around an A5 and later-type stars it is overestimated. For stars of spectral type F5 and later and an intermediate ice fraction of
  , the median overestimation of amin is as high as
  –5. For the highest ice fractions
  the medianvalues increase up to
  –14. These large overestimations can partly be explained by the underestimation of the inner disk radius Rin, which results in an increase in the abundance of hot grains, an effect which is relaxed in the case of larger grains. Although fitting to the radial profiles allows the inner disk radius Rin to be determined reliably, the same general trend with spectral type is present for the determination of the minimum grain size amin as for the results of fitting to the SED (see Fig. 4 middle). Nonetheless, the results of radial profile fitting show a different trend with ice fraction
  . With increasing
  the median estimation
  increases to a maximum for ice fractions
  –0.7 and then drops sharply. The highest overestimations occur for spectral types of F5 and later; they are in the median
  –4 (see Sect. 3.1.4 for parameters influencing the estimation of the minimum grain size amin).
The results of the combined fit (see Fig. 4 right) are between the results of the SED and radial profiles. We find the same clear trend with spectral type toward an overestimation of the minimum grain size amin.
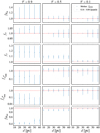 |
Fig. 3 Statistical results of the process of fitting to radial profiles for different distances to the debris disk system. Shown are the results for the three ice fractions
|

Stellar parameters of main-sequence stars.
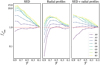 |
Fig. 4 Statistical results of the estimation of the minimum ice-mixture grain size
|


4 Conclusions
We investigated the effect of water ice on the quantitative analysis of debris disk observations. Based on the simulation of selected typical observable quantities of a large set of ice-containing debris disks around a star similar to β Pic, we derived the values of various parameters describing these disks. While the simulated observations were performed for debris disks with an ice fraction of 0.1–0.9, compact silicate dust grains were assumed in the analysis of those observations.
To model the icy dust material we employed EMT mixtures of ice and silicate. Ice sublimation was considered by replacing an ice-mixture grain with a porous silicate grain if its temperature exceeded the ice sublimation temperature. We analyzed SEDs, radial profiles, and a combination of the two. Furthermore, we investigated the influence of the distance to the debris disk system, and thus the impact of the achievable spatial resolution for fixed instrument characteristics, that is, angular resolution. We found that when fitting radial profiles, for the debris disk parameters inner radius Rin, exponent of the radial density distribution α, and minimum grain size amin the reliability of the derived parameter values degrades with decreasing spatial resolution, while the exponent of the grain size distribution γ and the disk mass Mtot are barely affected. Lastly, we examined the influence of the stellar spectral type (A0 to K5) on the analysis.
We found that by using radial profiles the inner disk radius Rin and the exponent of the radial density distribution α can be constrained well, regardless of the ice fraction  and spectral type. However, there is one exception. For the grains covering a large size range (a ~ 5 μm up to several hundred μm), the sublimation of ice occurs in a rather small radial range, almost independent of the ice fraction
  , but mainly determined by the spectral type of the central star. If this radial range is located inside the dust distribution, we found an overestimation of the inner disk radius Rin. For very luminous stars this also causes the slope of the radial density distribution α being determined too flat. We found this only for the A0-type central star. Therefore, if dust grains are expected to be icy in a given debris disk, for the analysis of observations a dust model is needed that can distinguish between grains in inner disk regions without ice and grains in outer disk regions with ice. Otherwise, the size of the inner disk cavity is overestimated. This can alter the implications for possible stellar companions orbiting within that cavity (e.g., Krivov 2010, and references therein). By artificially suppressing ice sublimation we found that the bias in the estimation of the parameters Rin and α has only a minor effect on the derived values of the other parameters.
The exponent of the grain size distribution γ is overestimated with increasing ice fraction  by both SED and radial profile fitting, independent of the spectral type. This is likewise found by Brunngräber et al. (2017). We conclude that the behavior is solely caused by assuming the grains in the reference disks to be too massive. Our results are in agreement with other methods to determine the grain size distribution exponent. For example, Löhne (2020) systematically investigated the method of deriving γ from the spectral index at millimeter photometric measurements between λ ~ 1 mm and 7–9 mm, that is, at longer wavelengths than we considered in our study. He finds larger values of γ when using silicate than when using pure crystalline water ice. The grain size distribution exponent γ is linked to the critical energy for fragmentation and dispersal
  (Matthews et al. 2014). For the highest value of
  we found median overestimations by a factor of almost 1.2. Such an overestimation of γ could for instance lead to a critical energy
  in the gravity regime (γ ~ 3.0) being determined as being in the strength regime (γ ~ 3.6).
Within the considered grain size interval the resulting disk mass also does not depend on the spectral type. We found an underestimation with increasing ice fraction  which is stronger when fitting to the SED as to radial profiles. While for low values of
  the median estimation is reliable, the level of underestimation increases along with
  up to a factor of ~ 0.25 for the SED fit and ~0.4 for both, the radial profile and the combined fit.
The derived minimum grain size amin strongly depends on the spectral type, particularly toward late spectral types: the later the spectral type, the higher the overestimation. The trend isfound both for SED and radial profile fitting, but is particularly strong for the former. Regarding SED fitting, analyzing the SEDs of 34 Herschel resolved debris disks using compact silicate as dust material, Pawellek et al. (2014) find the same trend. For some solar-like stars the blow-out grain size is overestimated by a factor of up to amin/abo ~ 10. In addition to other possible explanations, they propose that this trend could be caused by water ice making up parts of the dust material. With ice fractions of  we find suchlarge overestimations in our study, and can confirm their assumption. Likewise, assuming an ice-mixture similar to ours with
  , Morales et al. (2016) find a similar trend by analyzing a sample of A-type and solar-like stars. For the solar-like stars they find amin∕abo ~ 5–6, while for theA-type stars amin∕abo ~ 1. From our results alarger ice fraction
  would decrease the ratio they find for the solar-like stars. However, water ice is likely not the only solution to the mismatch between the values of the minimum grain size amin determined from observations on the one hand and the blow-out grain size abo determined on the basis of simple dust/star models on the other hand. Other factors discussed so far are dust grain porosity (Kirchschlager & Wolf 2013; Pawellek & Krivov 2015; Brunngräber et al. 2017), inequalities in the dust production and destruction rates (Thébault & Wu 2008), and the surface energy constraint (Krijt & Kama 2014; Pawellek & Krivov 2015; Thebault 2016).
Our study is based on synthetic observations at wavelengths from 10–1300 μm where the thermal emission of the dust grains dominates the radiation. At shorter wavelengths toward the optical to near-infrared wavelength range the relative importance of the stellar light scattered by the dust grains increases. Due to the anisotropy of the scattering function, the disk inclination becomes another parameter that would have to be considered in the analysis. In addition, the direct stellar radiation complicates the analysis unless the debris disk can be spatially resolved and clearly be distinguished from the central star. Nonetheless, there are instruments already providing us with spatially resolved images in the respective wavelengths such as the HST, GPI, SCExAO, and SPHERE, and new instruments with increased sensitivity and angular resolving capabilities are expected to become available, such as the Extremely Large Telescope (ELT) and the JWST.
Acknowledgements
The authors thank the anonymous referee for his comments and suggestions that helped to improve the presentation of the results. This research has made use of NASA’s Astrophysics Data System Bibliographic Services, adstex (https://github.com/yymao/adstex), a modified A&A bibliography style file (https://github.com/yangcht/AA-bibstyle-with-hyperlink), Ipython (Perez & Granger 2007), Jupyter notebooks (Kluyver et al. 2016), Astropy (https://www.astropy.org), a community-developed core Python package for Astronomy (Astropy Collaboration 2013, 2018), Matplotlib (Hunter 2007) and Numpy (Harris et al. 2020). This work was supported by the Research Unit FOR 2285 “Debris Disks in Planetary Systems” of the Deutsche Forschungsgemeinschaft (DFG). The authors acknowledge the DFG for financial support under contract WO 857/15-2.
Appendix A Simulated spatially resolved images
To simulate the observation of a spatially resolved image, we convolve the image with a circular two-dimensional Gaussian to simulate thetelescope beam. The beam size applied depends on the respective instrument and wavelength. For Herschel/PACS we use values for the FWHM stated by Booth et al. (2013) for DEBRIS survey images. For ALMA, the beam size varies with different telescope array configurations. We use values from the Cycle 8 Technical Handbook (Remijan et al. 2020, Table 7.1) for the C-1 configuration. By using a circular beam shape we assume the object to be observed at zenith.
We extract radial profiles starting at the image center and sample them with multiples of the respective beam FWHM. This causes the number of data points of the radial profiles to vary with wavelength. See Table A.1 for the adopted values of FWHM, the corresponding instrument and the number of radial profile data points.
As an interferometric array, ALMA is only sensitive up to a maximum angular scale (named maximum recoverable scale in the Technical Handbook) which depends on the smallest baseline in the array. Accurate modeling of ALMA observations is beyond the scope of this study. The ALMA wavelengths and beam sizes only serve as a general blueprint to model our synthetic observations. Thus, we neglect the maximum recoverable scale.
Instrument beam sizes and number of radial profile data points
References
- Astropy Collaboration (Robitaille, T. P., et al.) 2013, A&A, 558, A33 [NASA ADS] [CrossRef] [EDP Sciences] [Google Scholar]
- Astropy Collaboration (Price-Whelan, A. M., et al.) 2018, AJ, 156, 123 [Google Scholar]
- Aumann, H. H. 1985, PASP, 97, 885 [Google Scholar]
- Aumann, H. H., Gillett, F. C., Beichman, C. A., et al. 1984, ApJ, 278, L23 [CrossRef] [Google Scholar]
- Beuzit, J. L., Vigan, A., Mouillet, D., et al. 2019, A&A, 631, A155 [NASA ADS] [CrossRef] [EDP Sciences] [Google Scholar]
- Binney, J., & Merrifield, M. 1998, Galactic Astronomy (Princeton NJ: Princeton University Press) [Google Scholar]
- Booth, M., Kennedy, G., Sibthorpe, B., et al. 2013, MNRAS, 428, 1263 [Google Scholar]
- Brunngräber, R., Wolf, S., Kirchschlager, F., & Ertel, S. 2017, MNRAS, 464, 4383 [CrossRef] [Google Scholar]
- Burns, J. A., Lamy, P. L., & Soter, S. 1979, Icarus, 40, 1 [Google Scholar]
- Campo Bagatin, A., Cellino, A., Davis, D. R., Farinella, P., & Paolicchi, P. 1994, Planet. Space Sci., 42, 1079 [NASA ADS] [CrossRef] [Google Scholar]
- Chen, C. H., Fitzgerald, M. P., & Smith, P. S. 2008, ApJ, 689, 539 [NASA ADS] [CrossRef] [Google Scholar]
- Crifo, F., Vidal-Madjar, A., Lallement, R., Ferlet, R., & Gerbaldi, M. 1997, A&A, 320, L29 [NASA ADS] [Google Scholar]
- Curtis, D. B., Rajaram, B., Toon, O. B., & Tolbert, M. A. 2005, Appl. Opt., 44, 4102 [NASA ADS] [CrossRef] [Google Scholar]
- de Vries, B. L., Acke, B., Blommaert, J. A. D. L., et al. 2012, Nature, 490, 74 [NASA ADS] [CrossRef] [Google Scholar]
- Dent, W. R. F., Wyatt, M. C., Roberge, A., et al. 2014, Science, 343, 1490 [NASA ADS] [CrossRef] [Google Scholar]
- Dohnanyi, J. S. 1969, J. Geophys. Res., 74, 2531 [Google Scholar]
- Draine, B. T. 2003, ApJ, 598, 1026 [Google Scholar]
- Draine, B. T., & Lee, H. M. 1984, ApJ, 285, 89 [NASA ADS] [CrossRef] [Google Scholar]
- Eiroa, C., Fedele, D., Maldonado, J., et al. 2010, A&A, 518, L131 [NASA ADS] [CrossRef] [EDP Sciences] [Google Scholar]
- Eiroa, C., Marshall, J. P., Mora, A., et al. 2013, A&A, 555, A11 [NASA ADS] [CrossRef] [EDP Sciences] [Google Scholar]
- Gaia Collaboration (Prusti, T., et al.) 2016, A&A, 595, A1 [NASA ADS] [CrossRef] [EDP Sciences] [Google Scholar]
- Gaia Collaboration (Brown, A. G. A., et al.) 2021, A&A, 649, A1 [NASA ADS] [CrossRef] [EDP Sciences] [Google Scholar]
- Gardner, J. P., Mather, J. C., Clampin, M., et al. 2006, Space Sci. Rev., 123, 485 [Google Scholar]
- Garnett, J. C. M. 1904, Phil. Trans. R. Soc. London Ser. A, 203, 385 [CrossRef] [Google Scholar]
- Gray, R. O., Corbally, C. J., Garrison, R. F., et al. 2006, AJ, 132, 161 [Google Scholar]
- Greaves, J. S., Holland, W. S., Wyatt, M. C., et al. 2005, ApJ, 619, L187 [NASA ADS] [CrossRef] [Google Scholar]
- Grigorieva, A., Thébault, P., Artymowicz, P., & Brandeker, A. 2007, A&A, 475, 755 [NASA ADS] [CrossRef] [EDP Sciences] [Google Scholar]
- Harper, D. A., Runyan, M. C., Dowell, C. D., et al. 2018, J. Astron. Instrum., 7, 1840008 [Google Scholar]
- Harris, C. R., Millman, K. J., van der Walt, S. J., et al. 2020, Nature, 585, 357 [NASA ADS] [CrossRef] [Google Scholar]
- Häßner, D., Mutschke, H., Blum, J., Zeller, T., & Gundlach, B. 2018, MNRAS, 481, 5022 [CrossRef] [Google Scholar]
- Holland, W. S., Bintley, D., Chapin, E. L., et al. 2013, MNRAS, 430, 2513 [Google Scholar]
- Hughes, A. M., Duchêne, G., & Matthews, B. C. 2018, ARA&A, 56, 541 [Google Scholar]
- Hunter, J. D. 2007, Comput. Sci. Eng., 9, 90 [NASA ADS] [CrossRef] [Google Scholar]
- Husser, T. O., Wende-von Berg, S., Dreizler, S., et al. 2013, A&A, 553, A6 [NASA ADS] [CrossRef] [EDP Sciences] [Google Scholar]
- Jovanovic, N., Martinache, F., Guyon, O., et al. 2015, PASP, 127, 890 [NASA ADS] [CrossRef] [Google Scholar]
- Jura, M., Malkan, M., White, R., et al. 1998, ApJ, 505, 897 [NASA ADS] [CrossRef] [Google Scholar]
- Kervella, P., Thévenin, F., Morel, P., et al. 2004, in Stars as Suns: Activity, Evolution and Planets, eds. A. K. Dupree, & A. O. Benz (Cambridge: Cambridge University Press), 219, 80 [NASA ADS] [Google Scholar]
- Kim, M., Wolf, S., Löhne, T., Kirchschlager, F., & Krivov, A. V. 2018, A&A, 618, A38 [NASA ADS] [CrossRef] [EDP Sciences] [Google Scholar]
- Kim, M., Wolf, S., Potapov, A., Mutschke, H., & Jäger, C. 2019, A&A, 629, A141 [NASA ADS] [CrossRef] [EDP Sciences] [Google Scholar]
- Kirchschlager, F., & Wolf, S. 2013, A&A, 552, A54 [NASA ADS] [CrossRef] [EDP Sciences] [Google Scholar]
- Kluyver, T., Ragan-Kelley, B., Pérez, F., et al. 2016, Jupyter Notebooks, a publishing format for reproducible computational workflows, eds. F. Loizides, & B. Schmidt (Netherlands: IOS Press), 87 [Google Scholar]
- Kobayashi, H., Watanabe, S.-i., Kimura, H., & Yamamoto, T. 2008, Icarus, 195, 871 [NASA ADS] [CrossRef] [Google Scholar]
- Kobayashi, H., Kimura, H., Yamamoto, S., Watanabe, S. I., & Yamamoto, T. 2010, Earth Planets Space, 62, 57 [NASA ADS] [CrossRef] [Google Scholar]
- Krijt, S., & Kama, M. 2014, A&A, 566, L2 [NASA ADS] [CrossRef] [EDP Sciences] [Google Scholar]
- Krivov, A. V. 2010, Res. Astron. Astrophys., 10, 383 [Google Scholar]
- Krivov, A. V., Löhne, T., & Sremčević, M. 2006, A&A, 455, 509 [NASA ADS] [CrossRef] [EDP Sciences] [Google Scholar]
- Kurz, R., Guilloteau, S., & Shaver, P. 2002, The Messenger, 107, 7 [NASA ADS] [Google Scholar]
- Lagage, P. O., Pel, J. W., Authier, M., et al. 2004, The Messenger, 117, 12 [NASA ADS] [Google Scholar]
- Lebreton, J., Augereau, J. C., Thi, W. F., et al. 2012, A&A, 539, A17 [NASA ADS] [CrossRef] [EDP Sciences] [Google Scholar]
- Lecavelier Des Etangs, A., Vidal-Madjar, A., & Ferlet, R. 1998, A&A, 339, 477 [NASA ADS] [Google Scholar]
- Li, A., & Greenberg, J. M. 1998, A&A, 331, 291 [NASA ADS] [Google Scholar]
- Lisse, C. M., Wyatt, M. C., Chen, C. H., et al. 2012, ApJ, 747, 93 [CrossRef] [Google Scholar]
- Löhne, T. 2020, A&A, 641, A75 [NASA ADS] [CrossRef] [EDP Sciences] [Google Scholar]
- Löhne, T., Augereau, J. C., Ertel, S., et al. 2012, A&A, 537, A110 [NASA ADS] [CrossRef] [EDP Sciences] [Google Scholar]
- MacGregor, M. A., Wilner, D. J., Rosenfeld, K. A., et al. 2013, ApJ, 762, L21 [CrossRef] [Google Scholar]
- MacGregor, M. A., Matrà, L., Kalas, P., et al. 2017, ApJ, 842, 8 [CrossRef] [Google Scholar]
- Macintosh, B., Graham, J., Palmer, D., et al. 2006, SPIE Conf. Ser., 6272, 62720L [Google Scholar]
- Marino, S., Carpenter, J., Wyatt, M. C., et al. 2018, MNRAS, 479, 5423 [NASA ADS] [CrossRef] [Google Scholar]
- Matthews, B. C., Sibthorpe, B., Kennedy, G., et al. 2010, A&A, 518, L135 [NASA ADS] [CrossRef] [EDP Sciences] [Google Scholar]
- Matthews, B. C., Krivov, A. V., Wyatt, M. C., Bryden, G., & Eiroa, C. 2014, in Protostars and Planets VI, eds. H. Beuther, R. S. Klessen, C. P. Dullemond, & T. Henning (Tucson: University of Arizona Press), 521 [Google Scholar]
- Mie, G. 1908, Ann. Phys., 330, 377 [Google Scholar]
- Minowa, Y., Hayano, Y., Oya, S., et al. 2010, SPIE Conf. Ser., 7736, 77363N [NASA ADS] [Google Scholar]
- Morales, F. Y., Bryden, G., Werner, M. W., & Stapelfeldt, K. R. 2013, ApJ, 776, 111 [NASA ADS] [CrossRef] [Google Scholar]
- Morales, F. Y., Bryden, G., Werner, M. W., & Stapelfeldt, K. R. 2016, ApJ, 831, 97 [Google Scholar]
- Moro-Martin, A., Wyatt, M. C., Malhotra, R., & Trilling, D. E. 2008, in The Solar System Beyond Neptune, eds. M. A. Barucci, H. Boehnhardt, D. P. Cruikshank, & A. Morbidelli (Tucson: The University of Arizona Press), 465 [Google Scholar]
- Pawellek, N., & Krivov, A. V. 2015, MNRAS, 454, 3207 [Google Scholar]
- Pawellek, N., Krivov, A. V., Marshall, J. P., et al. 2014, ApJ, 792, 65 [Google Scholar]
- Perez, F., & Granger, B. E. 2007, Comput. Sci. Eng., 9, 21 [Google Scholar]
- Petrenko, V., & Whitworth, R. 2002, Physics of Ice (Oxford: Oxford University Press) [CrossRef] [Google Scholar]
- Pilbratt, G. L., Riedinger, J. R., Passvogel, T., et al. 2010, A&A, 518, L1 [NASA ADS] [CrossRef] [EDP Sciences] [Google Scholar]
- Poglitsch, A., Waelkens, C., Geis, N., et al. 2010, A&A, 518, L2 [NASA ADS] [CrossRef] [EDP Sciences] [Google Scholar]
- Pontoppidan, K. M., Salyk, C., Bergin, E. A., et al. 2014, in Protostars and Planets VI, eds. H. Beuther, R. S. Klessen, C. P. Dullemond, & T. Henning (Tucson: University of Arizona Press), 363 [Google Scholar]
- Potapov, A., Mutschke, H., Seeber, P., Henning, T., & Jäger, C. 2018, ApJ, 861, 84 [NASA ADS] [CrossRef] [Google Scholar]
- Poynting, J. H. 1904, Phil. Trans. R. Soc. London Ser. A, 202, 525 [CrossRef] [Google Scholar]
- Reinert, C., Mutschke, H., Krivov, A. V., Löhne, T., & Mohr, P. 2015, A&A, 573, A29 [NASA ADS] [CrossRef] [EDP Sciences] [Google Scholar]
- Remijan, A., Biggs, A., Cortes, P., et al. 2020, ALMA Technical Handbook, ALMA Doc. 8.3, ver. 1.0 [Google Scholar]
- Rieke, G. H., Young, E. T., Engelbracht, C. W., et al. 2004, ApJS, 154, 25 [Google Scholar]
- Robertson, H. P. 1937, MNRAS, 97, 423 [NASA ADS] [Google Scholar]
- Rodigas, T. J., Stark, C. C., Weinberger, A., et al. 2015, ApJ, 798, 96 [Google Scholar]
- Strubbe, L. E., & Chiang, E. I. 2006, ApJ, 648, 652 [NASA ADS] [CrossRef] [Google Scholar]
- Temi, P., Hoffman, D., Ennico, K., & Le, J. 2018, J. Astron. Instrum., 7, 1840011 [NASA ADS] [CrossRef] [Google Scholar]
- Thebault, P. 2016, A&A, 587, A88 [NASA ADS] [CrossRef] [EDP Sciences] [Google Scholar]
- Thébault, P., & Augereau, J. C. 2007, A&A, 472, 169 [NASA ADS] [CrossRef] [EDP Sciences] [Google Scholar]
- Thebault, P., & Kral, Q. 2019, A&A, 626, A24 [NASA ADS] [CrossRef] [EDP Sciences] [Google Scholar]
- Thébault, P., & Wu, Y. 2008, A&A, 481, 713 [Google Scholar]
- van Leeuwen, F. 2007, A&A, 474, 653 [CrossRef] [EDP Sciences] [Google Scholar]
- Warren, S. G. 1984, Appl. Opt., 23, 1206 [NASA ADS] [CrossRef] [Google Scholar]
- Werner, M. W., Roellig, T. L., Low, F. J., et al. 2004, ApJS, 154, 1 [NASA ADS] [CrossRef] [Google Scholar]
- Wolf, S., & Voshchinnikov, N. V. 2004, Comput. Phys. Commun., 162, 113 [Google Scholar]
- Wyatt, M. 2020, in The Trans-Neptunian Solar System, eds. D. Prialnik, M. A. Barucci, & L. Young (Amsterdam: Elsevier), 351 [CrossRef] [Google Scholar]
- Wyatt, S. P., & Whipple, F. L. 1950, ApJ, 111, 134 [NASA ADS] [CrossRef] [Google Scholar]
- Wyatt, M. C., Clarke, C. J., & Booth, M. 2011, Celest. Mech. Dyn. Astron., 111, 1 [NASA ADS] [CrossRef] [Google Scholar]
- Zook, H. A., & Berg, O. E. 1975, Planet. Space Sci., 23, 183 [Google Scholar]
In the Gaia Early Data Release 3 this value has been updated to 19.635 pc (Gaia Collaboration 2016, 2021).
All Tables
All Figures
|
Fig. 1 Blow-out grain sizes abo of grains consisting of an ice-mixture or porous silicate for different volume fractions of ice
|
| In the text | |
|
Fig. 2 Statistical results of the fitting process of 8000 model parameter sets based on the SED (left), the radial profiles (middle), and the combination of the two (right). The blue crosses indicate the median factor
|
| In the text | |
|
Fig. 3 Statistical results of the process of fitting to radial profiles for different distances to the debris disk system. Shown are the results for the three ice fractions
|
| In the text | |
|
Fig. 4 Statistical results of the estimation of the minimum ice-mixture grain size
|
| In the text | |
Current usage metrics show cumulative count of Article Views (full-text article views including HTML views, PDF and ePub downloads, according to the available data) and Abstracts Views on Vision4Press platform.
Data correspond to usage on the plateform after 2015. The current usage metrics is available 48-96 hours after online publication and is updated daily on week days.
Initial download of the metrics may take a while.