Fig. 2
Download original image
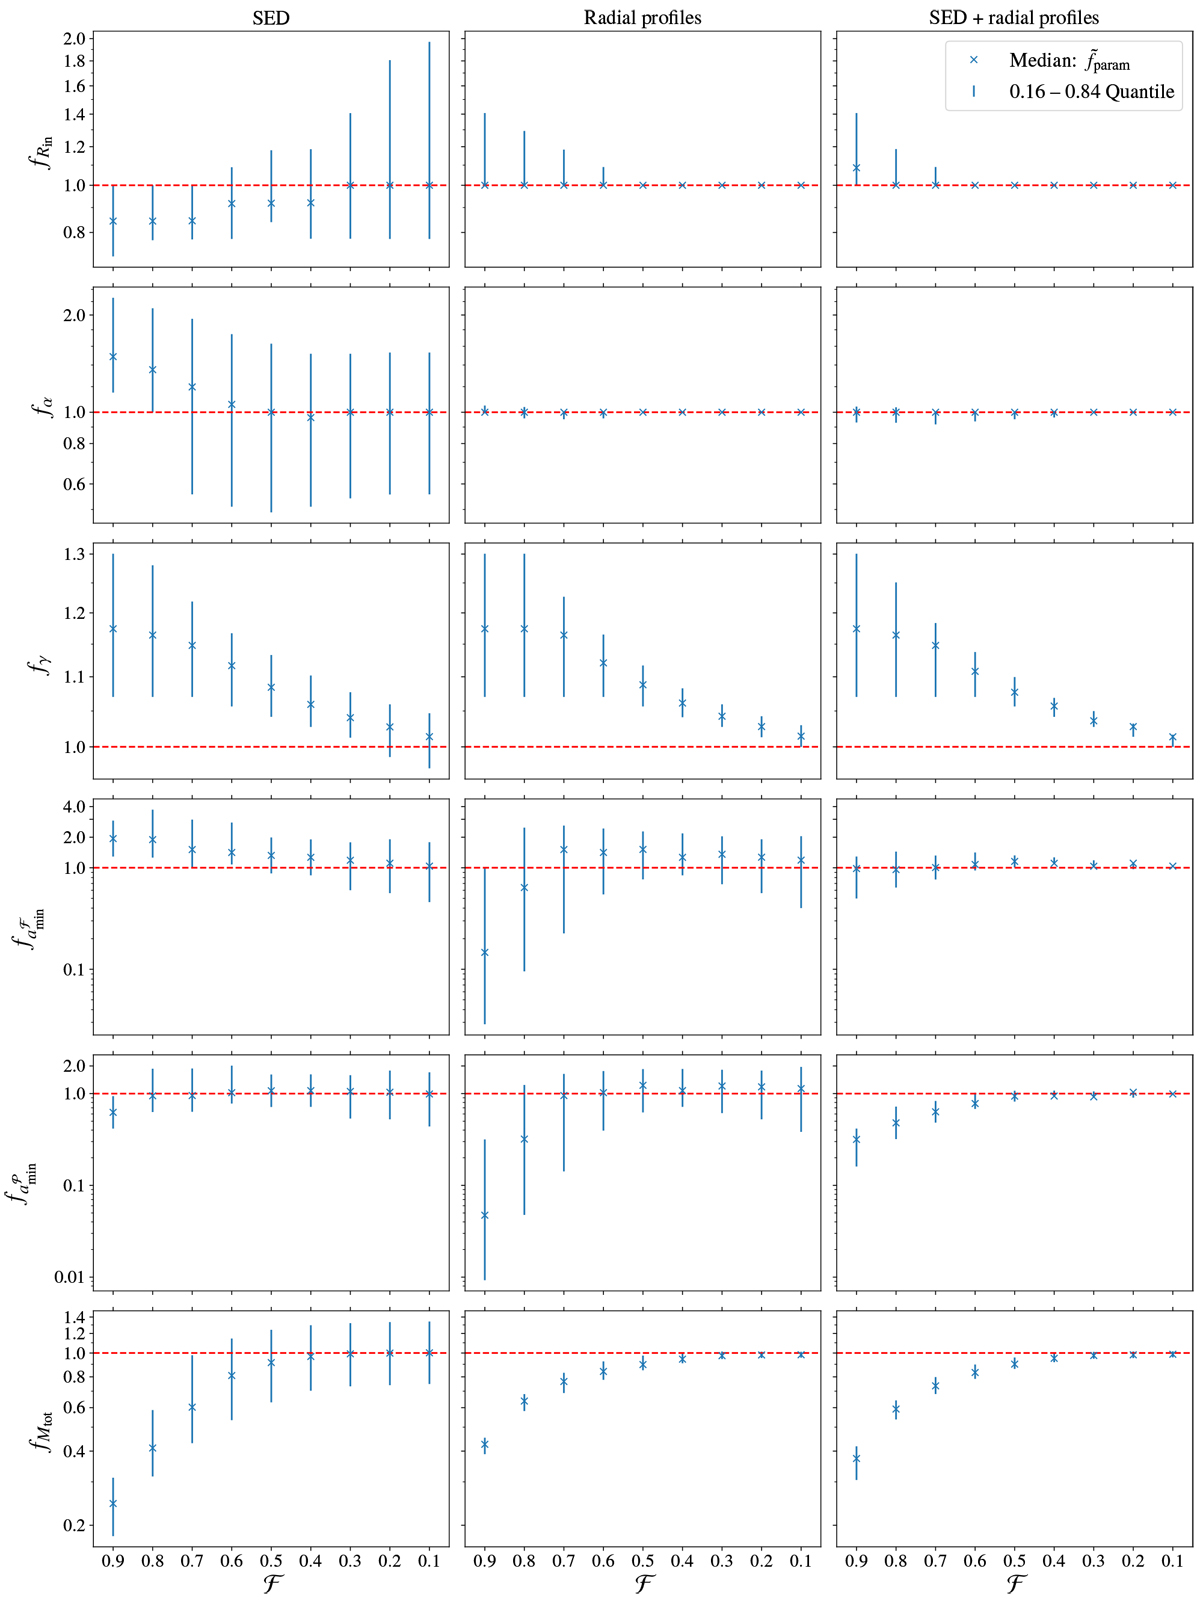
Statistical results of the fitting process of 8000 model parameter sets based on the SED (left), the radial profiles (middle), and the combination of the two (right). The blue crosses indicate the median factor
![]() of all parameter estimations as a function of decreasing ice fraction
of all parameter estimations as a function of decreasing ice fraction ![]() . For fparam > 1 (< 1) a given parameter is overestimated(underestimated). The dashed red line gives a correct estimation with fparam = 1. The vertical lines denote the range from the 0.16 to 0.84 quantile (i.e., 68% of the values lie within that interval).
. For fparam > 1 (< 1) a given parameter is overestimated(underestimated). The dashed red line gives a correct estimation with fparam = 1. The vertical lines denote the range from the 0.16 to 0.84 quantile (i.e., 68% of the values lie within that interval).
Current usage metrics show cumulative count of Article Views (full-text article views including HTML views, PDF and ePub downloads, according to the available data) and Abstracts Views on Vision4Press platform.
Data correspond to usage on the plateform after 2015. The current usage metrics is available 48-96 hours after online publication and is updated daily on week days.
Initial download of the metrics may take a while.