Free Access
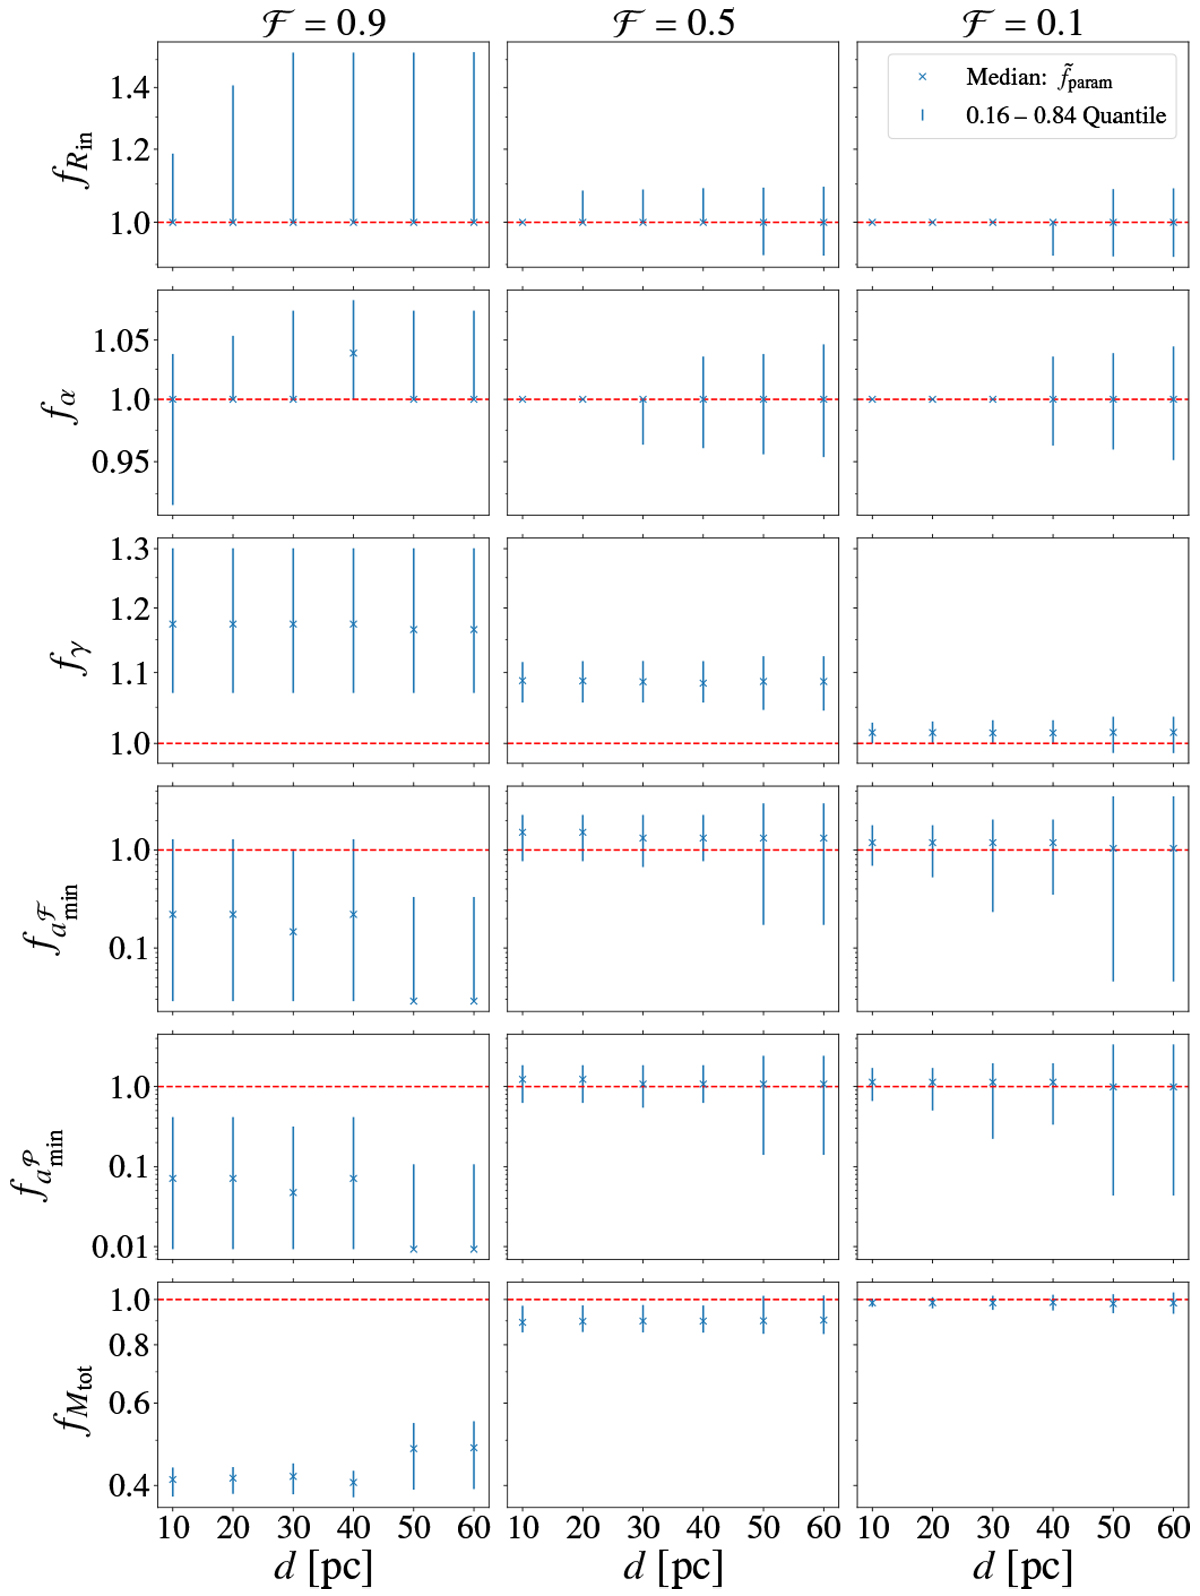
Fig. 3
Download original image
Statistical results of the process of fitting to radial profiles for different distances to the debris disk system. Shown are the results for the three ice fractions
![]() (left column), 0.5 (middle column), and 0.1 (right column). The results are presented as in Fig. 2.
(left column), 0.5 (middle column), and 0.1 (right column). The results are presented as in Fig. 2.
Current usage metrics show cumulative count of Article Views (full-text article views including HTML views, PDF and ePub downloads, according to the available data) and Abstracts Views on Vision4Press platform.
Data correspond to usage on the plateform after 2015. The current usage metrics is available 48-96 hours after online publication and is updated daily on week days.
Initial download of the metrics may take a while.