Fig. 6
Download original image
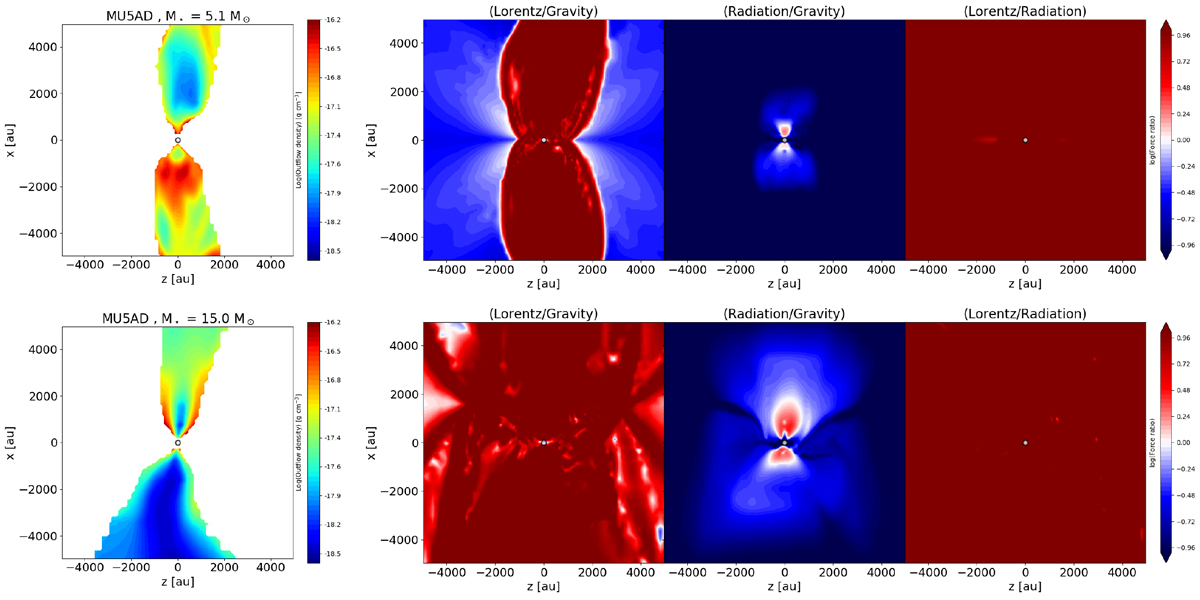
Density and force balance in the outflows for the MU5AD run when the sink mass is 5 M⊙ (top) and 15 M⊙ (bottom). Left panels: density cuts in the xz-plane within the outflow. Three other panels: maps of the ratios between the gravitational, the Lorentz, and the radiative forces. The colour maps are in logarithmic scale and the force ratio colour map is limited to the range [−1, 1] for plot readability, but its value can exceed these values. The bottom row is zoomed in the inner 10 000 au region.
Current usage metrics show cumulative count of Article Views (full-text article views including HTML views, PDF and ePub downloads, according to the available data) and Abstracts Views on Vision4Press platform.
Data correspond to usage on the plateform after 2015. The current usage metrics is available 48-96 hours after online publication and is updated daily on week days.
Initial download of the metrics may take a while.