Fig. 5
Download original image
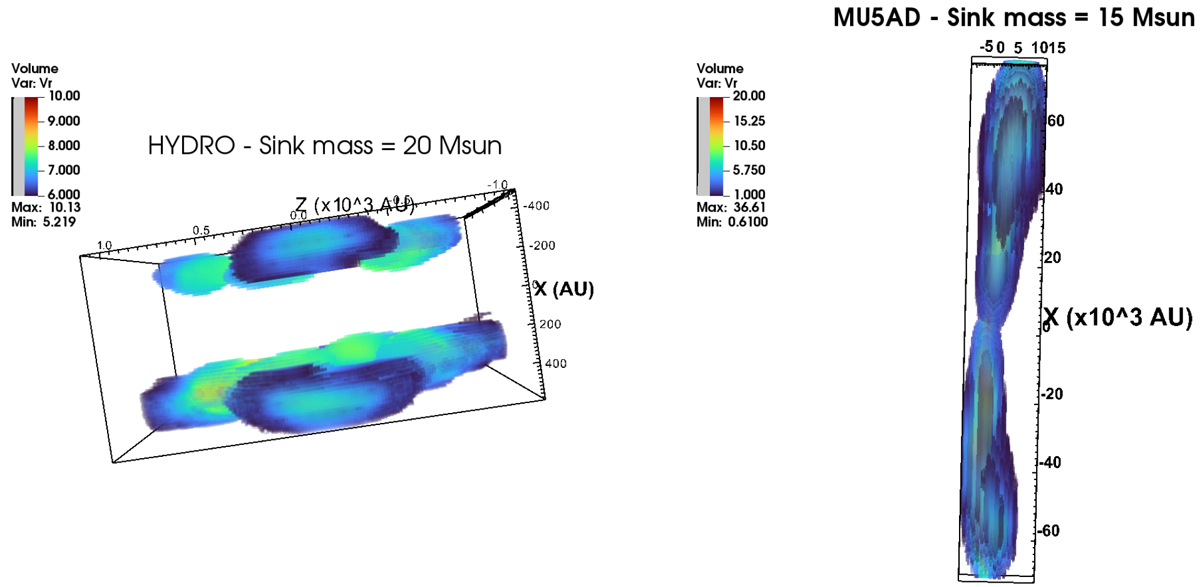
Volume rendering of the outflow in the HYDRO run at the end of the simulation (left) and in the MU5AD run when the sink mass is 15 M⊙ (right). The colour-coding represents the radial velocity and is given in km s−1. In the left panel (HYDRO), the region represents a box of ≃40003 au, while the vertical extent is of about 75 000 au in the right panel (MU5AD run).
Current usage metrics show cumulative count of Article Views (full-text article views including HTML views, PDF and ePub downloads, according to the available data) and Abstracts Views on Vision4Press platform.
Data correspond to usage on the plateform after 2015. The current usage metrics is available 48-96 hours after online publication and is updated daily on week days.
Initial download of the metrics may take a while.