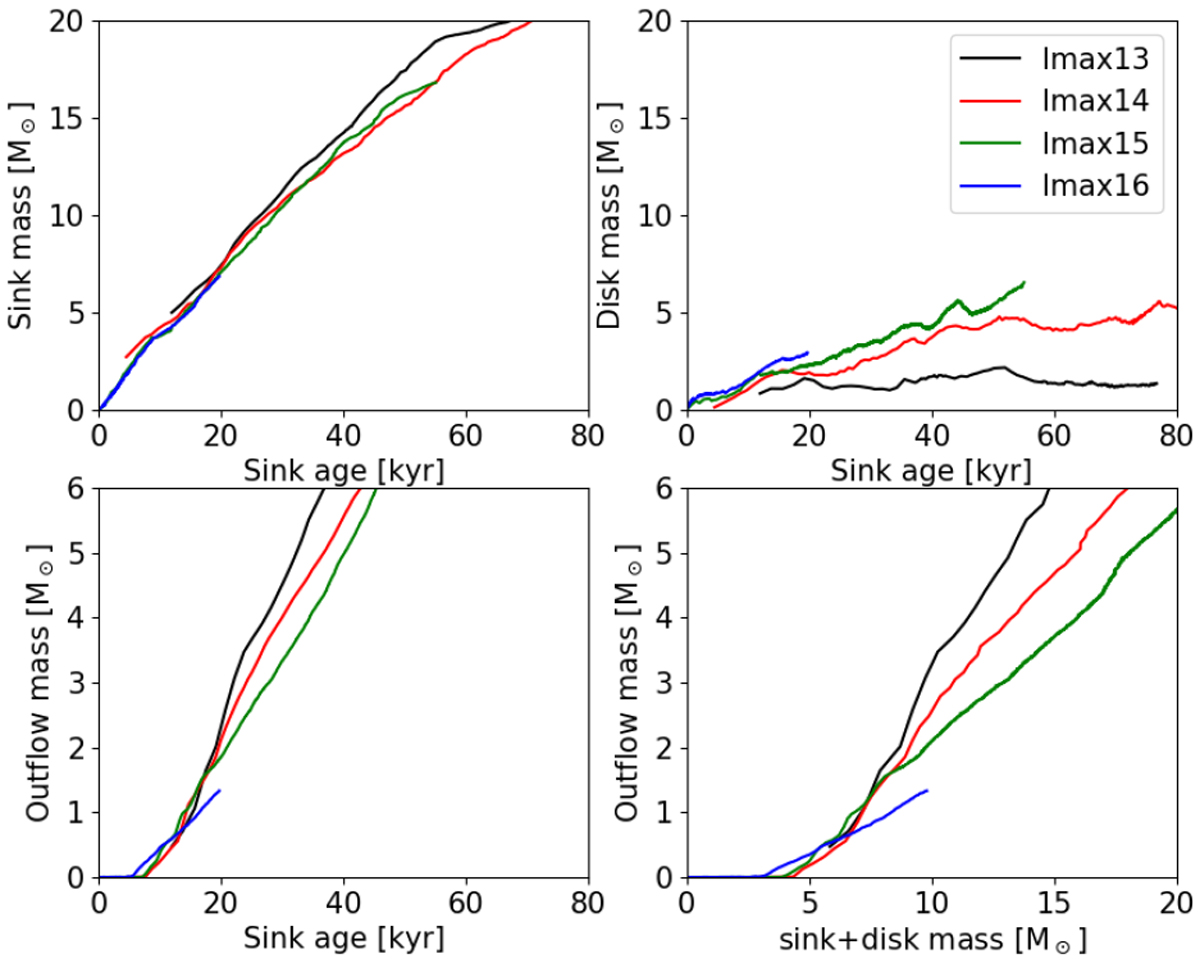
Fig. A.1
Download original image
Mass evolution of the sink (top-left), disc (top-right), and outflow (bottom-left) as a function of time after sink creation, and of the outflow as a function of the total disc+sink mass (bottom-right). The different colour scales for different maximum levels of refinement ℓmax and resolution are as follows: 20 au (black), 10 au (red), 5 au (green), and 2.5 au (blue).
Current usage metrics show cumulative count of Article Views (full-text article views including HTML views, PDF and ePub downloads, according to the available data) and Abstracts Views on Vision4Press platform.
Data correspond to usage on the plateform after 2015. The current usage metrics is available 48-96 hours after online publication and is updated daily on week days.
Initial download of the metrics may take a while.