Fig. 1
Download original image
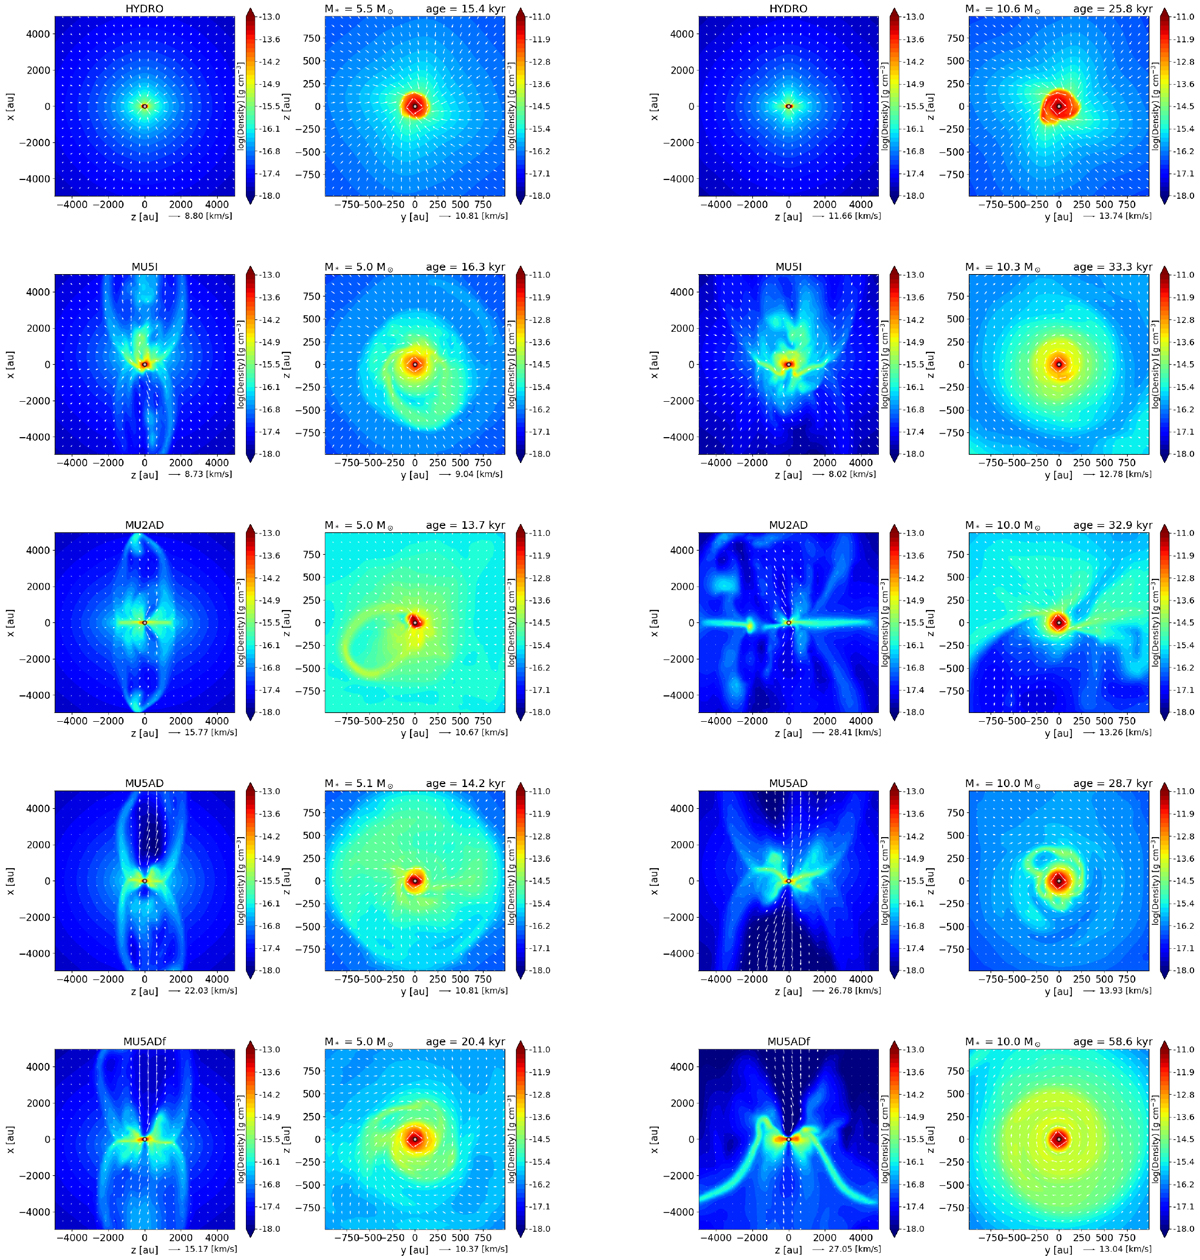
Density maps in the plane of the disc and perpendicular to it for the models HYDRO (top), MU5I (second line), MU2AD (third line), MU5AD (fourth line), and MU5ADf (bottom). Two different times are represented: M⋆ = 5 M⊙ (left) and M⋆ = 10 M⊙ (right). The mass M⋆ gives the total mass converted into sink particles at each snapshot. The arrows represent the velocity vectors in the plane.
Current usage metrics show cumulative count of Article Views (full-text article views including HTML views, PDF and ePub downloads, according to the available data) and Abstracts Views on Vision4Press platform.
Data correspond to usage on the plateform after 2015. The current usage metrics is available 48-96 hours after online publication and is updated daily on week days.
Initial download of the metrics may take a while.