Fig. 10.
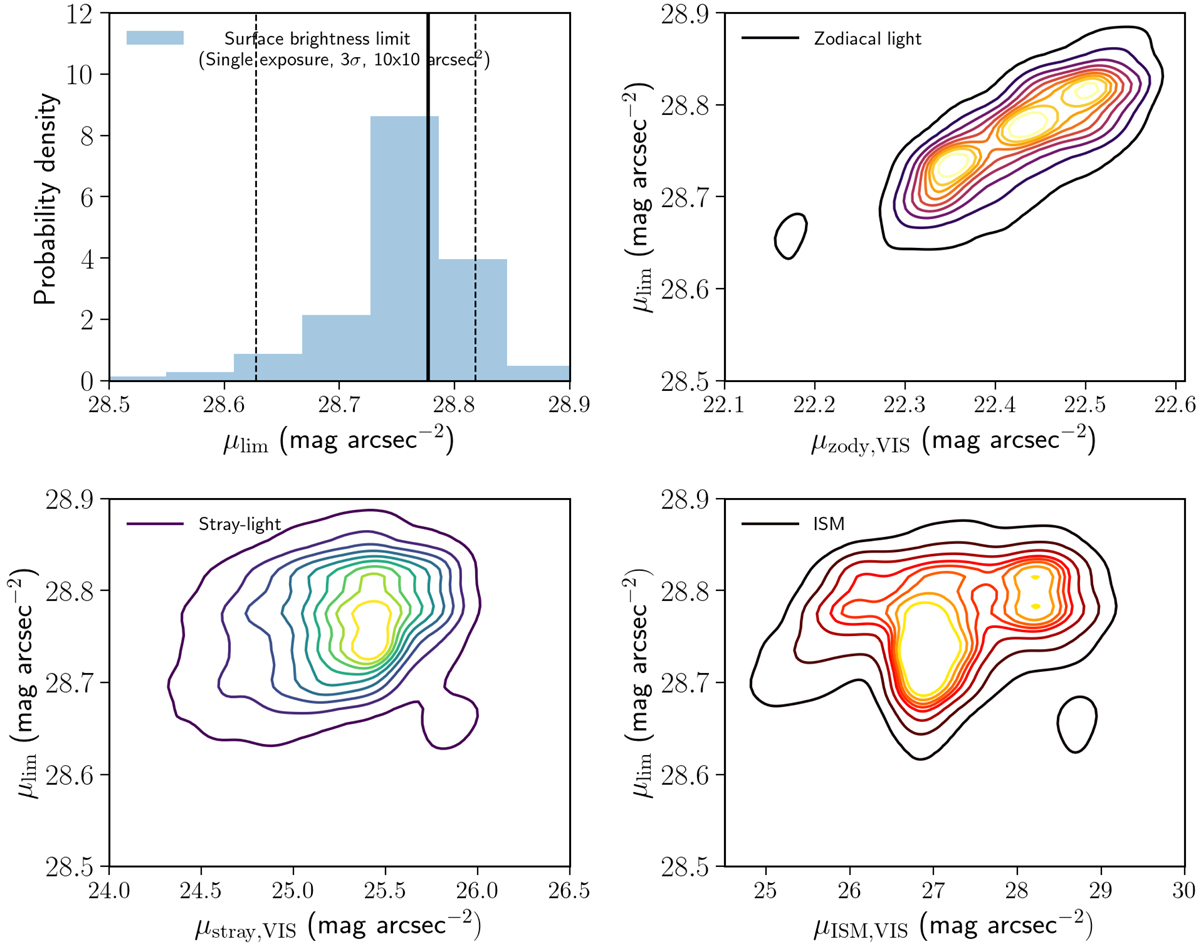
Download original image
Surface brightness limit of the individual simulated VIS exposures as a function of the different components of the sky background. Top left panel: histogram of the surface brightness limit per exposure (9916 simulations). The solid and dashed vertical lines represent the median value of the distribution and its ±1σ dispersion percentiles. Top right panel: zodiacal light surface brightness vs. limiting surface brightness. Bottom left panel: average stray-light light level (from Solar System bodies and stars) surface brightness vs. limiting surface brightness. Bottom right panel: interstellar medium surface brightness vs. limiting surface brightness. Contours represent nine equidistant levels of probability density between 10% and 90%.
Current usage metrics show cumulative count of Article Views (full-text article views including HTML views, PDF and ePub downloads, according to the available data) and Abstracts Views on Vision4Press platform.
Data correspond to usage on the plateform after 2015. The current usage metrics is available 48-96 hours after online publication and is updated daily on week days.
Initial download of the metrics may take a while.