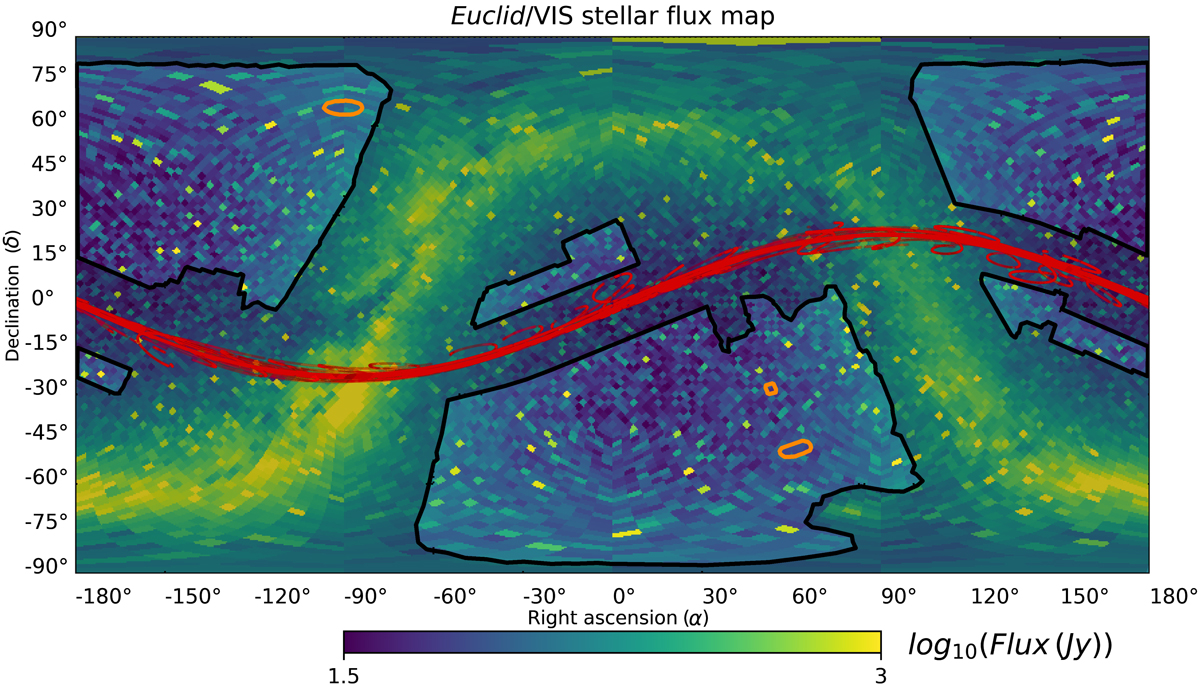
Fig. 1.
Download original image
Euclid/VIS stellar flux density map, based on Gaia (Gaia Collaboration 2016, 2018) and Sahlmann et al. (2016) catalogs: Black contours: footprint of a proxy of the Euclid/VIS Survey (Scaramella et al. 2021). The darkened regions, corresponding to the peak of the Milky Way emission, lie outside the footprint. The three regions marked with orange contours correspond to the Deep North, Deep South, and Deep Fornax fields. Color background: stellar flux density per HEALpix cell. The brightest region corresponds to the Galactic plane, a region avoided by the Euclid footprint. See the bottom color bar for the scaling. Red lines: projected trajectories of the main Solar System bodies (Mercury, Venus, Earth, Mars, Jupiter, Saturn, Uranus, and Neptune) as seen by Euclid during the mission, following the ecliptic plane (Giorgini et al. 2001).
Current usage metrics show cumulative count of Article Views (full-text article views including HTML views, PDF and ePub downloads, according to the available data) and Abstracts Views on Vision4Press platform.
Data correspond to usage on the plateform after 2015. The current usage metrics is available 48-96 hours after online publication and is updated daily on week days.
Initial download of the metrics may take a while.