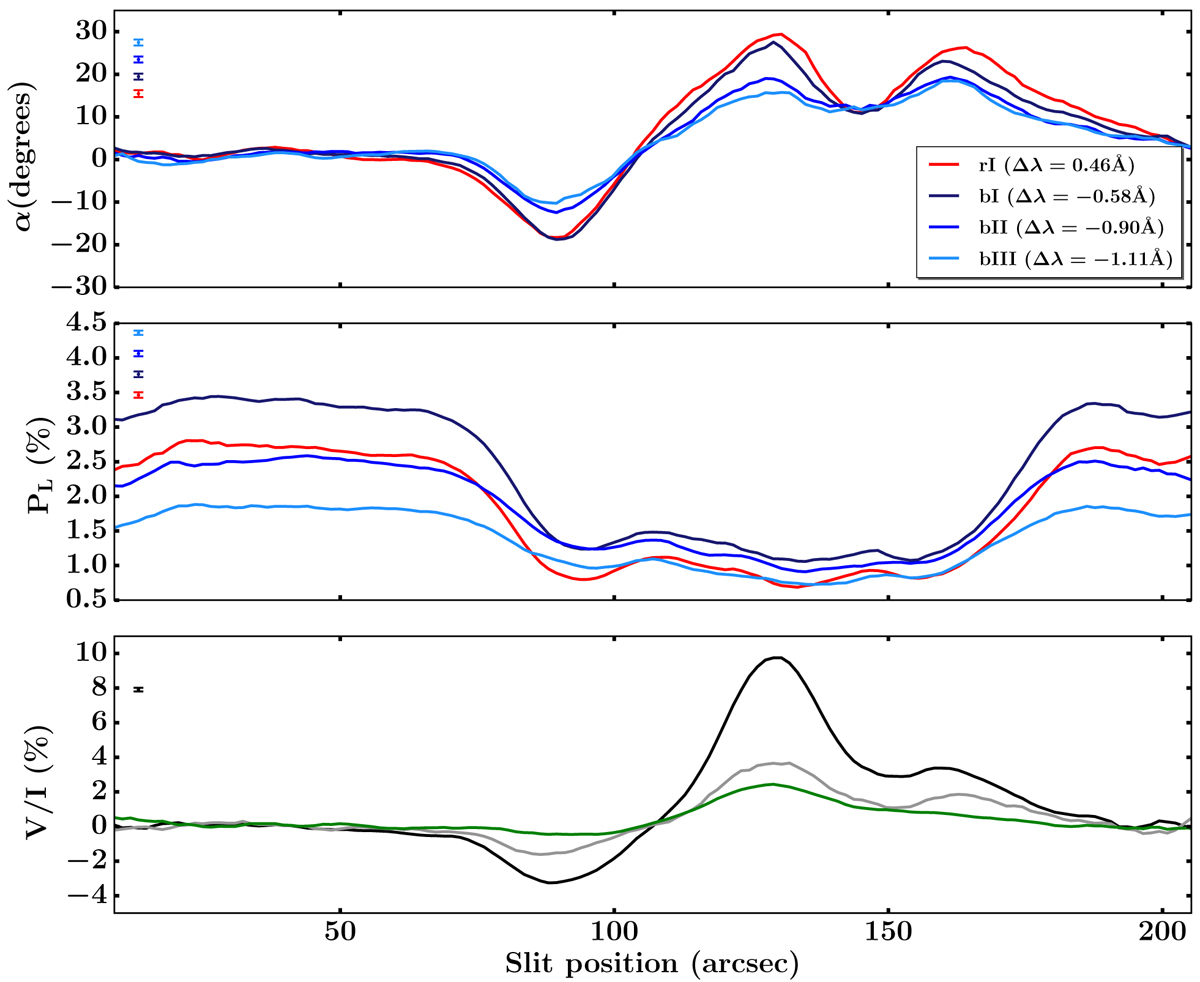
Fig. 1.
Download original image
Linear polarization angle (top panel) and total linear polarization fraction (middle panel) as a function of the position along the spectrograph’s slit at four different wavelengths in the wings of the Ca I line at 4227 Å. The various quantities are obtained by averaging the observed Stokes parameters over an interval of 50 mÅ, centered at the considered wavelength. These wavelengths are referred to as rI (red), bI (dark blue), bII (blue), and bIII (cyan), as discussed in the main text. The distance between the center of each interval and the center of the Ca I line (Δλ = λ − λ0) is indicated in the legend. For all figures the angle α is defined relative to a reference direction parallel to the nearest limb. In the bottom panel the amplitude of the blue peak of the V/I signal of Fe I 4224.2 Å (black line), Fe I 4228.7 Å (green line), and Ca I 4227 Å (gray line) are shown as a function of the slit position. The error bars are reported in the upper left of each panel. These data refer to a spectropolarimetric observation of a moderately active region close to the west limb performed on April 19, 2019. Figure adapted from Capozzi et al. (2020).
Current usage metrics show cumulative count of Article Views (full-text article views including HTML views, PDF and ePub downloads, according to the available data) and Abstracts Views on Vision4Press platform.
Data correspond to usage on the plateform after 2015. The current usage metrics is available 48-96 hours after online publication and is updated daily on week days.
Initial download of the metrics may take a while.