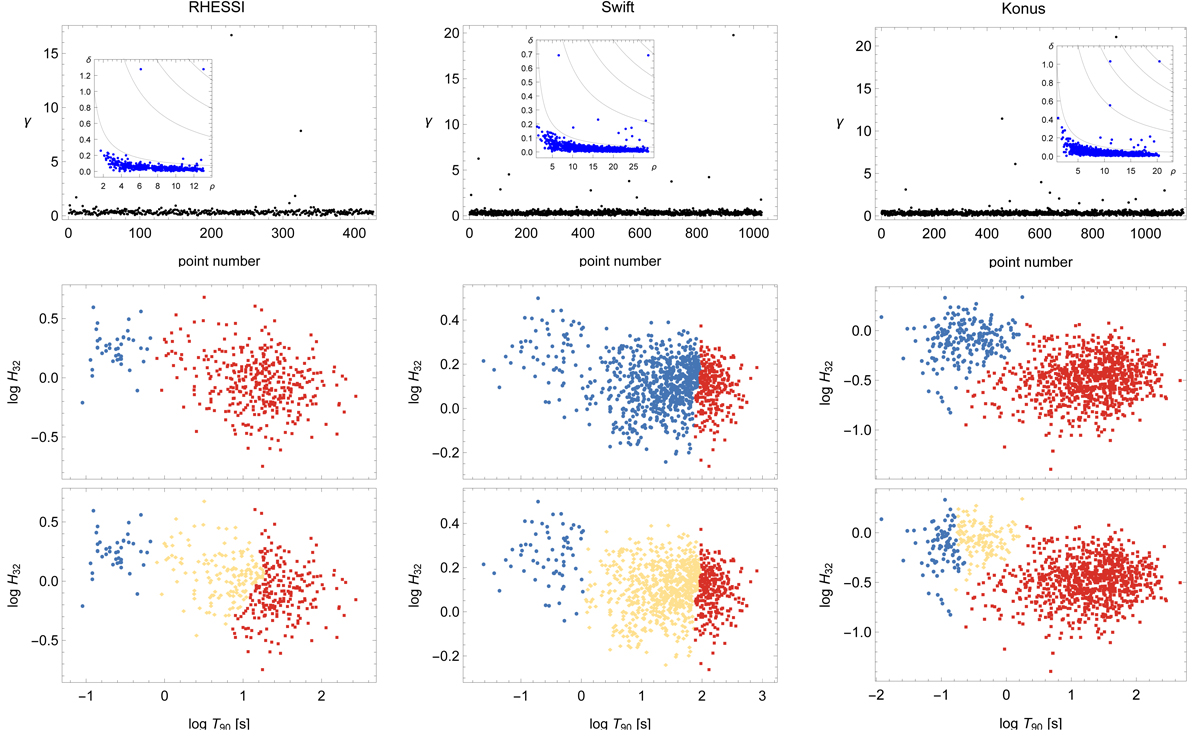
Fig. 6.
Download original image
Clusters identified in RHESSI (left column), Swift (middle column), and Konus GRBs (right column) with fastdp. Upper row: decision plots; the insets are the (ρ, δ) planes, with a few contours γ ≡ ρδ = const. displayed. Middle and bottom rows: resulting partitions into two and three clusters, respectively, with different colours (symbols – circles, squares, and diamonds) denoting the communities.
Current usage metrics show cumulative count of Article Views (full-text article views including HTML views, PDF and ePub downloads, according to the available data) and Abstracts Views on Vision4Press platform.
Data correspond to usage on the plateform after 2015. The current usage metrics is available 48-96 hours after online publication and is updated daily on week days.
Initial download of the metrics may take a while.